今回は streamlit、streamlit-aggrid、plotly モジュールを使用する必要があるため、最初に pip コマンドはこれらのモジュールをダウンロードします。そのうちの streamlit-aggrid は主にページ上にデータ テーブルを表示するために使用されます
pip install streamlit-aggrid
pip install plotly
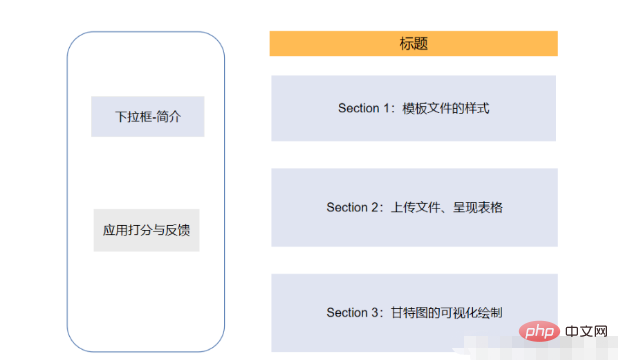
ページ全体の構造は、左側に Web ページの簡単な紹介を含むツールバーと、ユーザーに評価とフィードバックを提供するモジュール
があるということです。右側のセクション 1 は次のとおりです。主にCSV形式のプロジェクト計画書のテンプレート形式 タスク名、タスクの説明、開始時刻と終了時刻など、タスクの詳細をファイルに明確に記述します。セクション 2 では、ユーザーが独自の CSV ファイルをアップロードし、CSV ファイル内の項目のコンテンツを変更し、視覚的なプレゼンテーションを提供できるようにします。一方、セクション 3 では、上記のコンテンツを HTML ファイルにエクスポートします。
以下はページのコード部分です
from st_aggrid import AgGrid
import streamlit as st
import pandas as pd
import numpy as np
import plotly.express as px
from  PIL import Image
import io
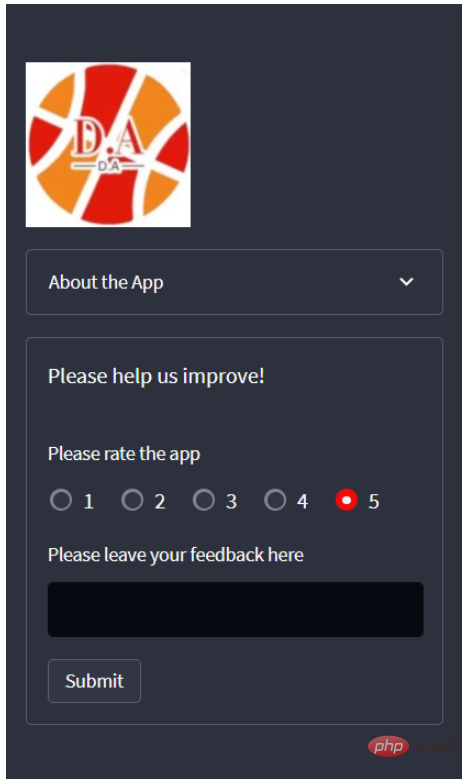
次に、主にページとスコアリング機能の簡単な紹介を提供するために、左側のツールバーの部分を開発します
logo = Image.open(r'wechat_logo.jpg')
st.sidebar.image(logo, width=120)
with st.sidebar.expander("关于此APP的功能"):
st.write("""
项目的简单介绍)
""")
with st.sidebar.form(key='columns_in_form',clear_on_submit=True):
st.write('反馈')
st.write('<style>div.row-widget.stRadio > div{flex-direction:row;} </style>', unsafe_allow_html=True) # 水平方向的按钮
rating=st.radio("打分",('1','2','3','4','5'),index=4)
text=st.text_input(label='反馈')
submitted = st.form_submit_button('提交')
if submitted:
st.write('感谢')
st.markdown('您的评分是:')
st.markdown(rating)
st.markdown('您的反馈是:')
st.markdown(text)結果を以下の図に示します。

次のステップは、メイン ページのセクション 1 の開発です。主に表示用 プロジェクト CSV ファイルのスタイル、それに含まれる列、列名など。コードは次のとおりです。
st.markdown(""" <style> .font {
font-size:30px ; font-family: 'Cooper Black'; color: #FF9633;}
</style> """, unsafe_allow_html=True)
st.markdown('<p class="font">上传您的CSV文件</p>', unsafe_allow_html=True)
st.subheader('第一步:下载模板文件')
image = Image.open(r'example.png') # 模板文件的截图
st.image(image, caption='确保列名是一致的')
@st.cache_data
def convert_df(df):
return df.to_csv().encode('utf-8')
df=pd.read_csv(r'template.csv', encoding='gbk')
csv = convert_df(df)
st.download_button(
label="下载模板",
data=csv,
file_name='project_template.csv',
mime='text/csv',
)ユーザーがテンプレート ファイルをダウンロードできるダウンロード ボタンを提供します。ワンクリックで、最終的な外観は次のようになります

次のステップは、独自の CSV ファイルをアップロードすることです。ここでは streamlit_aggrid モジュールを使用します。このモジュールの利点は、データ テーブルを表示し、その中のデータを変更できることです。
st.subheader('Step 2: Upload your project plan file')
uploaded_file = st.file_uploader(
    "上传文件",
    type=['csv'])
if uploaded_file is not None:
    Tasks = pd.read_csv(uploaded_file, encoding='gbk')
    Tasks['Start'] = Tasks['Start'].astype('datetime64')
    Tasks['Finish'] = Tasks['Finish'].astype('datetime64')

    grid_response = AgGrid(
        Tasks,
        editable=True,
        height=300,
        width='100%',
    )

    updated = grid_response['data']
df = pd.DataFrame(updated)output

次に、データの視覚的なプレゼンテーションです。ここでは、Plotly モジュールを使用してガント チャートを描画します。チームの次元またはプロジェクトの進捗状況に基づいて描画することを選択できます。コードは次のとおりです
st.subheader('第三部:绘制甘特图')

Options = st.selectbox("以下面哪种维度来绘制甘特图:", ['Team', 'Completion Pct'], index=0)
if st.button('绘制甘特图'):
    fig = px.timeline(
        df,
        x_start="Start",
        x_end="Finish",
        y="Task",
        color=Options,
        hover_name="Task Description"
    )

    fig.update_yaxes(
        autorange="reversed")

    fig.update_layout(
        title='Project Plan Gantt Chart',
        bargap=0.2,
        height=600,
        xaxis_title="Date",
        yaxis_title="Project Name",
        title_x=0.5,
        xaxis=dict(
            tickfont_size=15,
            tickangle=270,
            rangeslider_visible=True,
            side="top",
            showgrid=True,
            zeroline=True,
            showline=True,
            showticklabels=True,
            tickformat="%x\n",
        )
    )

    fig.update_xaxes(tickangle=0, tickfont=dict(family='Rockwell', color='blue', size=15))
    st.plotly_chart(fig, use_container_width=True)  # 绘制甘特图至页面上
    st.subheader(
        'Bonus: 导出至HTML')
    buffer = io.StringIO()
    fig.write_html(buffer, include_plotlyjs='cdn')
    html_bytes = buffer.getvalue().encode()
    st.download_button(
        label='Export to HTML',
        data=html_bytes,
        file_name='Gantt.html',
        mime='text/html'
    )
else:
st.write('---')以上がPython でガント チャート描画を実装するにはどうすればよいですか?の詳細内容です。詳細については、PHP 中国語 Web サイトの他の関連記事を参照してください。