
Google Chrome can not only be used to surf the Internet, but for developers, it is more like a powerful development aid.
If you want to do your job well, you must first sharpen your tools. Next, the author will share with you some ways to use Chrome.
If readers know how to add JavaScript breakpoints in Chrome, please continue reading; otherwise, please make up your own mind.
Suppose there is such a piece of code:
function test(){
var a, b, c, d, e;
a = 2;
b = a - 1;
b = 9;
c = 3;
d = 4;
e = (a b * c) * (a - d);
return e;
}
test();
The code itself is not important, what is important is the form.
Suppose e is the result we ultimately need, but find that the result is incorrect, so we set a breakpoint on the line where e is assigned a value.
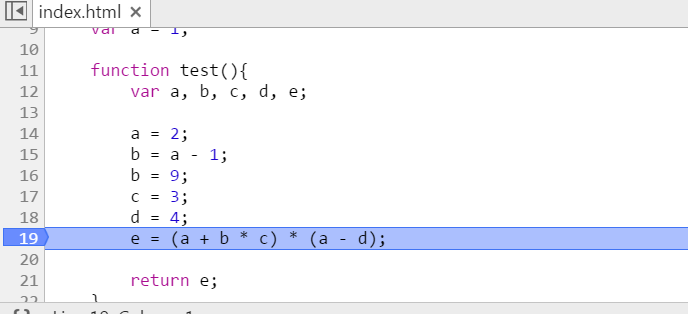
After setting the breakpoint, move the mouse to a variable and pause for a moment, Chrome will prompt you with the value of the variable at this time.
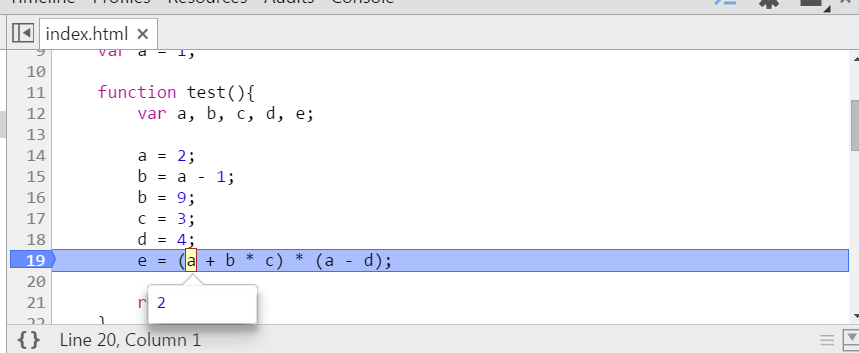
But the expression is rather complicated, and just looking at the value of a single variable has no effect. It all looks normal, but after calculation, it is wrong.
At this time, you probably want to know the result of this part (a b c). Don’t worry, select the expression first, then move the mouse to the selected area and stay for a while.
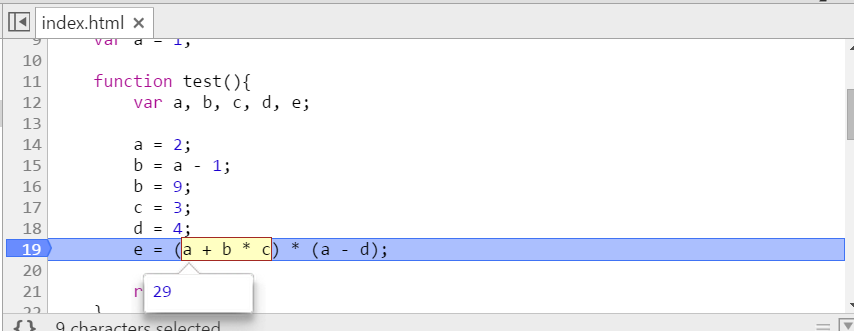
Chrome tells you the answer directly. The more interesting thing is yet to come.
Click the right mouse button directly on the selected area, and a menu will pop up. The top two items are: [Add to watch] and [Evaluate in console]. Please refer to the picture for the specific corresponding view.
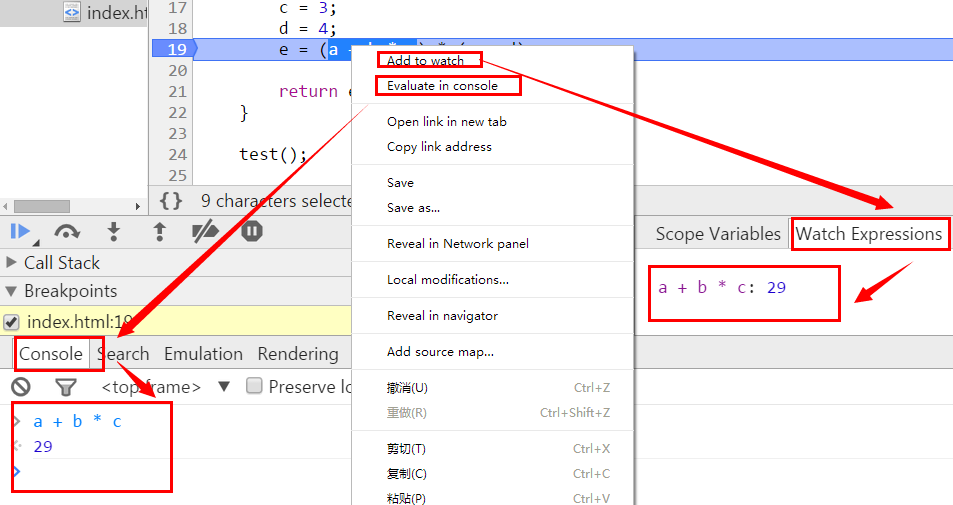
The so-called watch can be understood as monitoring. Some expressions are more important and the value of the expression may need to be monitored in real time during the entire debugging process. In this case, watch can be used.
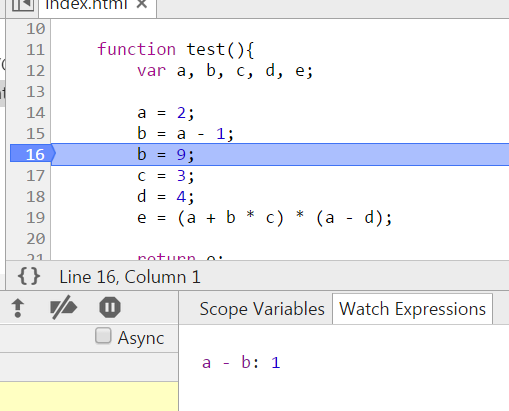
For example, we set the breakpoint at the line "b = 9;" and then add watch: "a - b" with a value of 1. As shown in the picture:
Click Next and execute "b = 9;", which means that the value of b has changed. At this time, look at the value of watch: "a - b", which is -7.
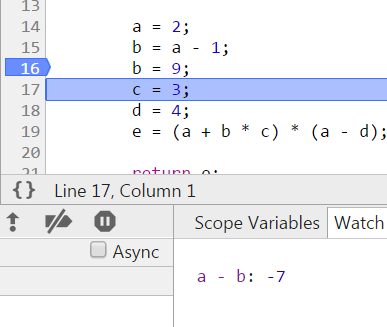
This achieves the effect of real-time monitoring, making debugging more convenient and faster.
Let’s take a look at what’s going on with the console.
Console is of course the console, and expressions can be evaluated directly in the console.
For example, if you want to know the result of (a b c), copy it directly to the console, press Enter, and the result will come out.
Wait, something seems wrong. Why does the console know the values of a, b, and c?
Executing JavaScript code in the console without breakpoints is global. In other words, a variable x is defined in the console at this time, and the scope of this x is global.
If you use the console while the program is interrupted, the console's scope faces the scope where it was interrupted. In other words, where the breakpoint is set (or where the code is executed), the scope of the console is there.
In this example, a variable a is defined in the global scope with a value of 1; at the same time, a local variable a is defined in the function test scope with a value of 2. Set a breakpoint at "a = 2;", enter a in the console, press Enter, and print out undefined.
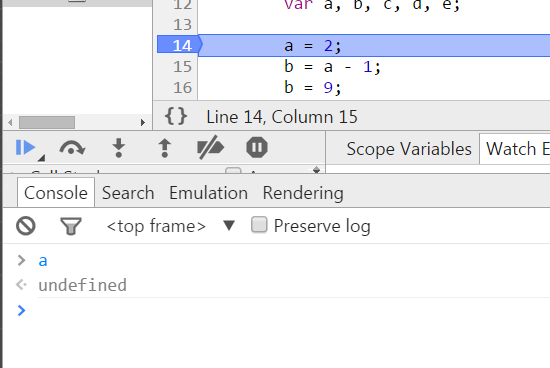
Because the program is interrupted inside the function test at this time, the program is executed in the function test, so the scope of the console is also in the function test, so the input a accesses the local variable a, but at this time the local variable a does not Assignment, so the result is undefined.
That’s all I’ll share this time. I’ll continue to share when I meet someone who is awesome. I hope it will be helpful to readers.


