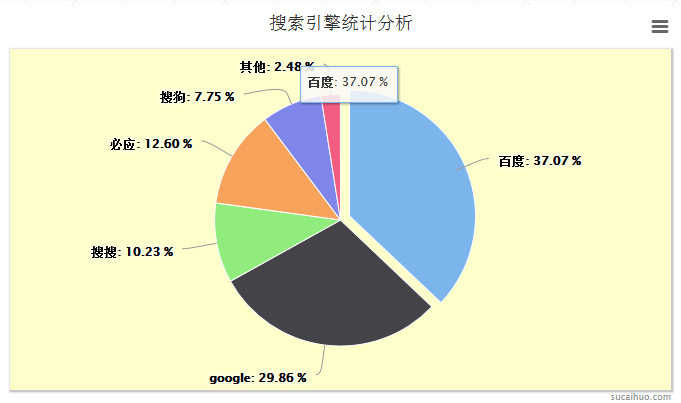

Mysql
First we create a chart_pie table as statistical data.
--
-- 表的结构 `chart_pie`
--

CREATE TABLE IF NOT EXISTS `chart_pie` (
 `id` int(11) NOT NULL AUTO_INCREMENT,
 `title` varchar(30) NOT NULL,
 `pv` int(10) NOT NULL,
 PRIMARY KEY (`id`)
) ENGINE=MyISAM DEFAULT CHARSET=utf8 AUTO_INCREMENT=7 ;

--
-- 转存表中的数据 `chart_pie`
--

INSERT INTO `chart_pie` (`id`, `title`, `pv`) VALUES
(1, '百度', 1239),
(2, 'google', 998),
(3, '搜搜', 342),
(4, '必应', 421),
(5, '搜狗', 259),
(6, '其他', 83);
PHP
In pie.php we need to generate data for the front-end call:
$query = mysql_query("select * from chart_pie");
while($row = mysql_fetch_array($query)){
 $arr[] = array(
  $row['title'],intval($row['pv'])
 );
}
$data = json_encode($arr);
jQuery
$(function() {
 $('#highcharts').highcharts({
  chart: {
   renderTo: 'chart_pie',
   //饼状图关联html元素id值
   defaultSeriesType: 'pie',
   //默认图表类型为饼状图
   plotBackgroundColor: '#ffc',
   //设置图表区背景色
   plotShadow: true //设置阴影
  },
  title: {
   text: '搜索引擎统计分析' //图表标题
  },
  credits: {
   text: 'jb51.net'
  },
  tooltip: {
   formatter: function() { //鼠标滑向图像提示框的格式化提示信息
    return '<b>' + this.point.name + '</b>: ' + twoDecimal(this.percentage) + ' %';
   }
  },
  plotOptions: {
   pie: {
    allowPointSelect: true,
    //允许选中,点击选中的扇形区可以分离出来显示
    cursor: 'pointer',
    //当鼠标指向扇形区时变为手型(可点击)
    //showInLegend: true, //如果要显示图例,可将该项设置为true
    dataLabels: {
     enabled: true,
     //设置数据标签可见,即显示每个扇形区对应的数据
     color: '#000000',
     //数据显示颜色
     connectorColor: '#999',
     //设置数据域扇形区的连接线的颜色
     style: {
      fontSize: '12px' //数据显示的大小
     },
     formatter: function() { //格式化数据
      return '<b>' + this.point.name + '</b>: ' + twoDecimal(this.percentage) + ' %';
      //return '<b>' + this.point.name + '</b>: ' + this.y ;
     }
    }
   }
  },
  series: [{ //数据列
   name: 'search engine',
   data: data //核心数据列来源于php读取的数据并解析成JSON
  }]
 });
});
In addition, when formatting data, if you want to display a percentage, you can use this.percentage. Highcharts will automatically convert integers into percentages. If you want to display the amount of data, use this.y directly.
The percentage code is as follows:
formatter: function() { //格式化数据
 return '<b>' + this.point.name + '</b>: ' + twoDecimal(this.percentage) + ' %';
}
The actual data is like this:
formatter: function() { //格式化数据
 return '<b>' + this.point.name + '</b>: ' + this.y ;
}
Finally we need to keep two decimal places, the code is posted below:
function twoDecimal(x) { //保留2位小数
 var f_x = parseFloat(x);
 if (isNaN(f_x)) {
  alert('错误的参数');
  return false;
 }
 var f_x = Math.round(x * 100) / 100;
 var s_x = f_x.toString();
 var pos_decimal = s_x.indexOf('.');
 if (pos_decimal < 0) {
  pos_decimal = s_x.length;
  s_x += '.';
 }
 while (s_x.length <= pos_decimal + 2) {
  s_x += '0';
 }
 return s_x;
}
Bar charts, pie charts, curve charts, etc. are all the same.
The above is the entire content of this article, I hope you all like it.


