When editing documents, we often need to display the data in tables or charts three-dimensionally to more intuitively display data relationships and trends. PHP editor Xiaoxin will next introduce the operation method of three-dimensional data display in word to help everyone easily realize data visualization so as to better understand and analyze the data.
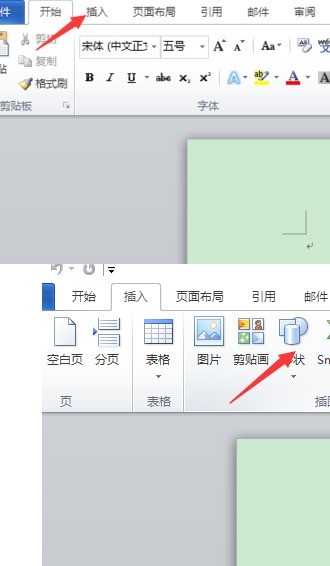
1. First, we open the Word document that requires data three-dimensionalization (I am taking a blank document as an example). Click the Insert button in the function box to insert the shape.

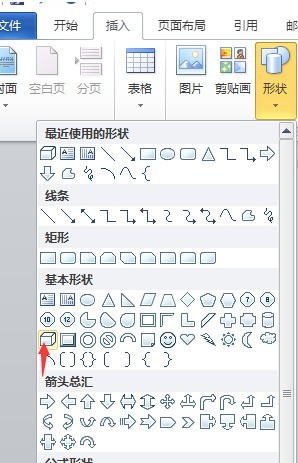
Click the function expansion box of the shape and select the stereogram in the basic shape. Click OK to insert the graphic into the document and complete the first step.

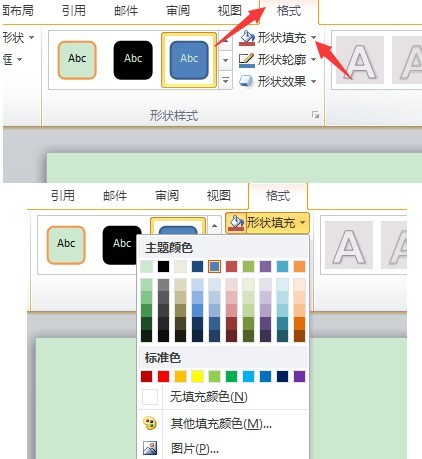
3. Continue to select Format in the menu function box, find the drawing tool function in the Format column, and select Shape Fill.

4. Finally, we draw different colors on different surfaces according to the needs of the actual situation, and the data stereogram is completed.
The above is the detailed content of How to operate three-dimensional data display in word. For more information, please follow other related articles on the PHP Chinese website!


