Home > Software Tutorial > Office Software > The operation process of making dynamic charts in PPT

The operation process of making dynamic charts in PPT

WBOY
Release: 2024-04-17 10:49:10
forward
984 people have browsed it

First select the chart to be created and add [Enter]-[Erase] in the animation menu bar.
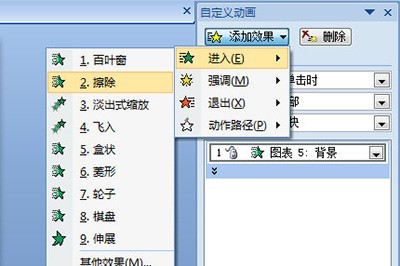
The operation process of making dynamic charts in PPT

This erasure icon provides unique animation options. Click the animation to enter the setting interface of the effect options. In the chart animation, several different erasing animation methods are prepared for us in PPT. , there are by series, by category, by elements in the series, and by elements in the category. You can use different erasing methods according to different needs.
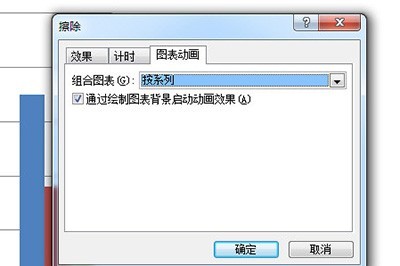
The operation process of making dynamic charts in PPT

Then play the animation again, and the chart will be displayed very vividly.

The above is the detailed content of The operation process of making dynamic charts in PPT. For more information, please follow other related articles on the PHP Chinese website!

source:zol.com.cn
Statement of this Website
The content of this article is voluntarily contributed by netizens, and the copyright belongs to the original author. This site does not assume corresponding legal responsibility. If you find any content suspected of plagiarism or infringement, please contact admin@php.cn
Popular Tutorials
More>
Latest Downloads
More>
Web Effects
Website Source Code
Website Materials
Front End Template