
php editor Zimo brings you a graphic tutorial on drawing a circular progress chart in PPT. A donut chart is a way to visually display progress and is suitable for showing project completion or task progress. Through this tutorial, you will learn how to draw a progress-like ring chart in PPT to make your presentation more vivid and interesting. Follow the steps and let’s explore together!
1. Insert an ellipse, [Insert - Shape - Ellipse], and press the left button of shift to draw a circle.
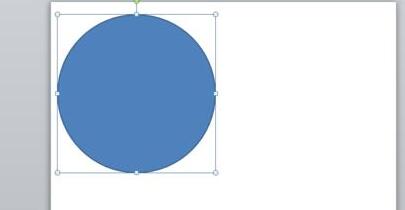
2. After inserting the circle, copy another circle, making a total of two circles.
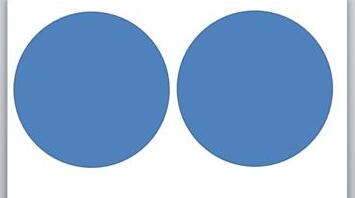
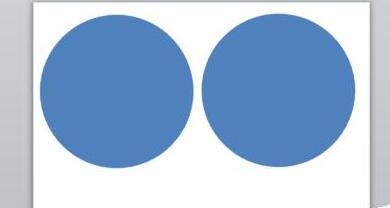
3. Select two circles respectively and set them to [No Outline]. 】Format - Shape Outline - No Outline【.
4. Select two circles respectively and choose any two colors. I used orange and purple as examples. 】Format - Shape Fill - Select Color【.
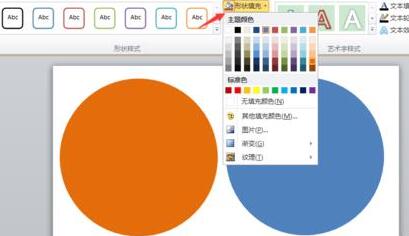
5. Select a circle and change it to [Hollow Arc]. 】Format-Insert Shape-Edit Shape-Select Hollow Arc【.
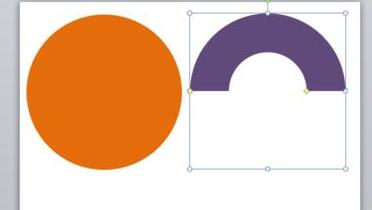
6. Click on the hollow arc to adjust the height and shape.
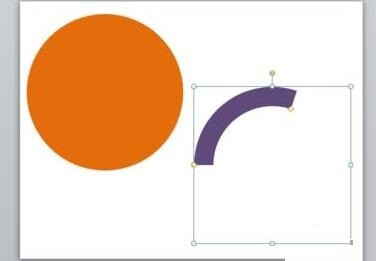
7. Click on the hollow arc and drag it into the circle. And select all, center top and bottom, center left and right.
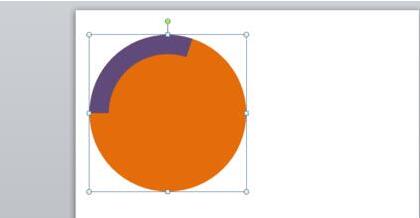
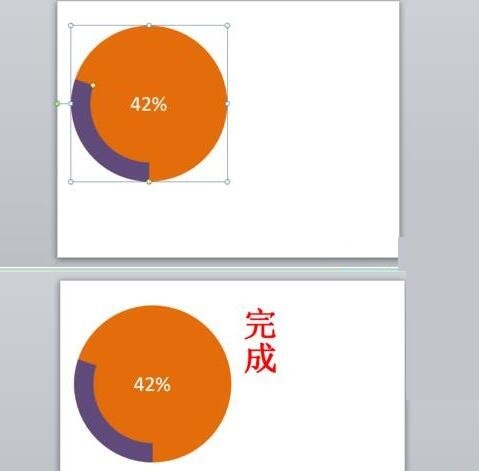
8. Select the circle, edit the text, and visually enter the proportion value as [42%].
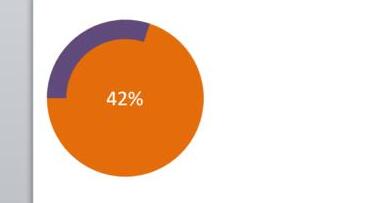
9. Select the hollow arc and select [Rotate 90° to the left]. 】Format - Rotation - Rotate 90 degrees [
Dear friends, I have just come into contact with PPT software. Come and learn the operation content of this article PPT to draw a ring chart similar to progress. I believe it. It will definitely be handy in future use.
The above is the detailed content of PPT graphic tutorial on drawing a progress-like ring chart. For more information, please follow other related articles on the PHP Chinese website!


