Rethinking the Open-Loop Evaluation of End-to-End Autonomous Driving in nuScenes
Keywords: end-to-end autonomous driving, nuScenes open-loop evaluation
Now Some autonomous driving systems are usually divided into three main tasks: perception, prediction and planning; the planning task involves predicting the trajectory of the vehicle based on internal intentions and the external environment, and controlling the vehicle. Most existing solutions evaluate their methods on the nuScenes data set. The evaluation indicators are L2 error and collision rate.
This article re-evaluates the existing evaluation indicators to explore whether they can be accurate. To measure the advantages of different methods. This article also designed an MLP-based method that takes raw sensor data (historical trajectory, speed, etc.) as input and directly outputs the future trajectory of the vehicle without using any perception and prediction information, such as camera images or LiDAR. Surprisingly: such a simple method achieves SOTA planning performance on the nuScenes dataset, reducing L2 error by 30%. Our further in-depth analysis provides some new insights into factors that are important for planning tasks on the nuScenes dataset. Our observations also suggest that we need to rethink the open-loop evaluation scheme for end-to-end autonomous driving in nuScenes.
This paper hopes to evaluate the open-loop evaluation scheme of end-to-end autonomous driving on nuScenes; without using vision and Lidar In this case, planning's SOTA can be achieved on nuScenes by using only the vehicle state and high-level commands (a total of 21-dimensional vectors) as input. The author thus pointed out the unreliability of the open-loop evaluation on nuScenes and gave two analyses: the vehicle trajectory on the nuScenes data set tends to go straight or have a very small curvature; the detection of collision rate is related to the grid density, and The collision annotation of the data set is also noisy, and the current method of evaluating collision rate is not robust and accurate enough;
Related work: ST-P3[1] proposes an interpretable vision-based end-to-end system that unifies feature learning for perception, prediction, and planning. UniAD[2] systematically designs Planning tasks, uses query-based design to connect multiple intermediate tasks, and can model and encode the relationship between multiple tasks; VAD[3] constructs scenes in a completely vectorized manner. Module does not require dense feature representation and is computationally more efficient.
This article hopes to explore whether existing evaluation indicators can accurately measure the advantages and disadvantages of different methods. This paper only uses the physical state of the vehicle while driving (a subset of the information used by existing methods) to conduct experiments, rather than using the perception and prediction information provided by cameras and lidar. In short, the model in this article does not use visual or point cloud feature encoders, and directly encodes the physical information of the vehicle into a one-dimensional vector, which is sent to the MLP after concat. The training uses GT trajectories for supervision, and the model directly predicts the trajectory points of the vehicle within a certain time in the future. Follow previous work, use L2 Error and collision rate (collision rate.) for evaluation on the nuScenes data setAlthough the model design is simple, the best Planning results are obtained. This article attributes this to the current Inadequacy of evaluation indicators. In fact, by using the past self-vehicle trajectory, speed, acceleration and time continuity, the future movement of the self-vehicle can be reflected to a certain extent
=4 frames of the self-vehicle's motion trajectory, instantaneous speed and acceleration

Advanced commands: Since our model does not use high-precision maps, advanced commands are required for navigation. Following common practice, three types of commands are defined: turn left, go straight, and turn right. Specifically, when the own vehicle will move left or right by more than 2m in the next 3 seconds, set the corresponding command to turn left or right, otherwise it will go straight. Use one-hot encoding with dimension 1x3 to represent high-level commands
Network structure: The network is a simple three-layer MLP (the input to output dimensions are 21-512-512-18 respectively), the final number of output frames = 6, each frame outputs its own vehicle The trajectory position (x, y coordinates) and heading angle (heading angle)

Loss function
Loss function: Use L1 Loss function for penalty
Dataset : Experiments are conducted on the nuScenes dataset, which consists of 1K scenes and approximately 40K keyframes, mainly collected in Boston and Singapore, using vehicles equipped with LiDAR and circumferential cameras. Data collected for each frame includes multi-view Camear images, LiDAR, velocity, acceleration, and more.
Evaluation metrics: Use the evaluation code of the ST-P3 paper (https://github.com/OpenPerceptionX/ST-P3/blob/main/stp3/metrics.py). Evaluate output traces for 1s, 2s and 3s time ranges. In order to evaluate the quality of the predicted self-vehicle trajectory, two commonly used indicators are calculated:
L2 Error: in meters, the predicted trajectory and true self-vehicle trajectory in the next 1s, 2s and 3s time range respectively. Calculate the average L2 error between trajectories;
collision rate: in percentage. In order to determine how often the self-vehicle collides with other objects, collisions are calculated by placing a box representing the self-vehicle at each waypoint on the predicted trajectory, and then detecting whether a collision occurs with the bounding boxes of vehicles and pedestrians in the current scene. Rate.
Hyperparameter settings and hardware: PaddlePaddle and PyTorch framework, AdamW optimizer (4e-6 lr and 1e-2 weight decay), cosine scheduler, trained for 6 epochs, batch size For 4, a V100 was used

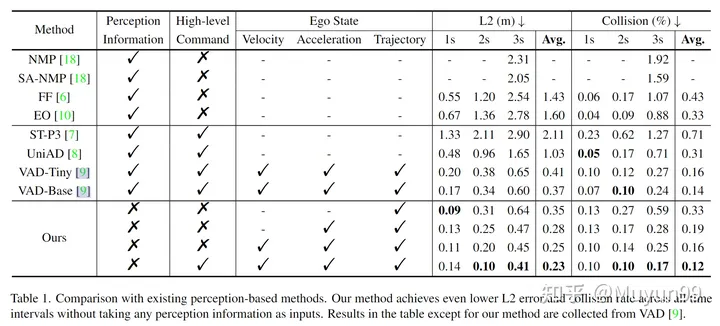
Table 1 Comparison with existing perception-based methods
Some ablation experiments were performed in Table 1. To analyze the impact of speed, acceleration, trajectory and High-level Command on the performance of this article's model. Surprisingly, using only trajectories as input and no perceptual information, our Baseline model already achieves lower average L2 error than all existing methods.
As we gradually add acceleration, velocity, and High-level Command to the input, the average L2 error and collision rate decrease from 0.35m to 0.23m, and from 0.33% to 0.12%. The model that takes both Ego State and High-level Command as input achieves the lowest L2 error and collision rate, surpassing all previous state-of-the-art perception-based methods, as shown in the last row.
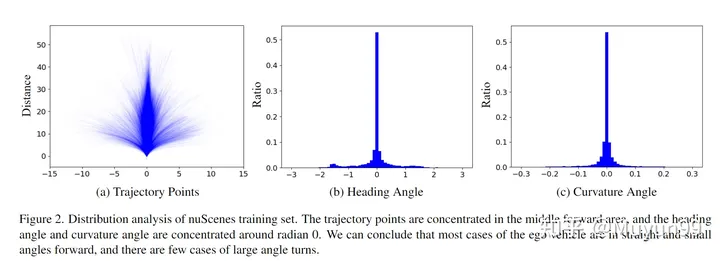
The article analyzes the distribution of self-vehicle status on the nuScenes training set from two perspectives: trajectory points in the next 3s; heading angle (heading / yaw angle) and curvature angles (curvature angles)

nuScenes Distribution analysis of the training set.
All future 3s trajectory points in the training set are plotted in Figure 2(a). As can be seen from the figure, the trajectory is mainly concentrated in the middle part (straight), and the trajectory is mainly a straight line, or a curve with very small curvature.
The heading angle represents the future direction of travel relative to the current time, while the curvature angle reflects the vehicle's turning speed. As shown in Figure 2 (b) and (c), nearly 70% of the heading and curvature angles lie within the range of -0.2 to 0.2 and -0.02 to 0.02 radians, respectively. This finding is consistent with the conclusions drawn from the trajectory point distribution.
Based on the above analysis of the distribution of trajectory points, heading angles and curvature angles, this article believes that in the nuScenes training set, the self-vehicle tends to move forward in a straight line and at a small angle when traveling within a short time range.

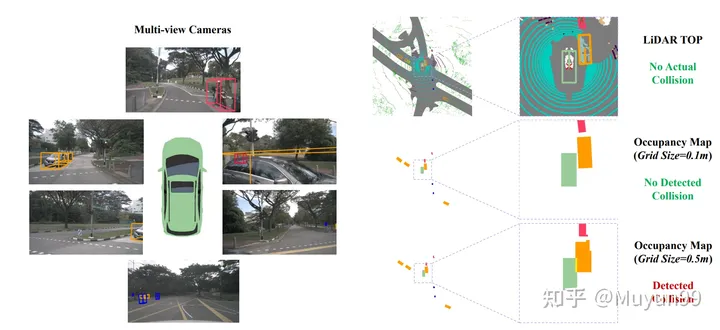
The different grid sizes of the Occupancy map will cause collisions in the GT trajectory
When calculating the collision rate, a common practice in existing methods is to combine the vehicle and Objects such as pedestrians are projected into Bird's Eye View (BEV) space, and then they are converted into occupied areas in the graph. And this is where the accuracy is lost, we found that a small percentage of GT trajectory samples (about 2%) also overlap with obstacles in the occupancy grid, but the self-vehicle will not actually overlap with any other objects when collecting data A collision occurs, which causes the collision to be incorrectly detected. Causes incorrect collisions when the ego vehicle is close to certain objects, e.g. smaller than the size of a single Occupancy map pixel.
Figure 3 shows an example of this phenomenon, as well as collision detection results for ground truth trajectories with two different grid sizes. Orange are vehicles that may be falsely detected as collisions. At the smaller grid size (0.1m) shown in the lower right corner, the evaluation system correctly identifies the GT trajectory as non-collisive, but at the larger grid size in the lower right corner (0.5m), incorrect collision detection will occur.
After observing the impact of occupied grid size on trajectory collision detection, we tested the grid size as 0.6m. The nuScenes training set has 4.8% collision samples, while the validation set has 3.0%. It is worth mentioning that when we used a grid size of 0.5m previously, only 2.0% of the samples in the validation set were misclassified as collisions. This once again demonstrates that current methods of estimating collision rates are not robust and accurate enough.
Author summary: The main purpose of this paper is to present our observations rather than to propose a new model. Although our model performs well on the nuScenes dataset, we acknowledge that it is an impractical toy that cannot be used in the real world. Driving without self-vehicle status is an insurmountable challenge. Nonetheless, we hope that our insights will stimulate further research in this area and enable a re-evaluation of progress in end-to-end autonomous driving.
This article is a thorough review of the recent end-to-end autonomous driving evaluation on the nuScenes data set. Whether it is implicit end-to-end direct output of Planning signals, or explicit end-to-end output with intermediate links, many of them are Planning indicators evaluated on the nuScenes data set, and Baidu's article pointed out that this kind of evaluation is not reliable. . This kind of article is actually quite interesting. It actually slaps many colleagues in the face when it is published, but it also actively promotes the industry to move forward. Maybe end-to-end planning does not need to be done (perception prediction is end-to-end), maybe everyone Doing more closed-loop tests (CARLA simulator, etc.) when evaluating performance can better promote the progress of the autonomous driving community and implement the paper into actual vehicles. The road to autonomous driving still has a long way to go~

Original link: https://mp.weixin.qq.com/s/skNDMk4B1rtvJ_o2CM9f8w
The above is the detailed content of Will end-to-end technology in the field of autonomous driving replace frameworks such as Apollo and autoware?. For more information, please follow other related articles on the PHP Chinese website!
 Introduction to the role of cloud servers
 Introduction to hard disk performance indicators
 How to update graphics card driver
 How to delete index in mysql
 chip
chip
 How to watch live broadcast playback records on Douyin
 InstantiationException exception solution
 How to recover permanently deleted files on computer


