
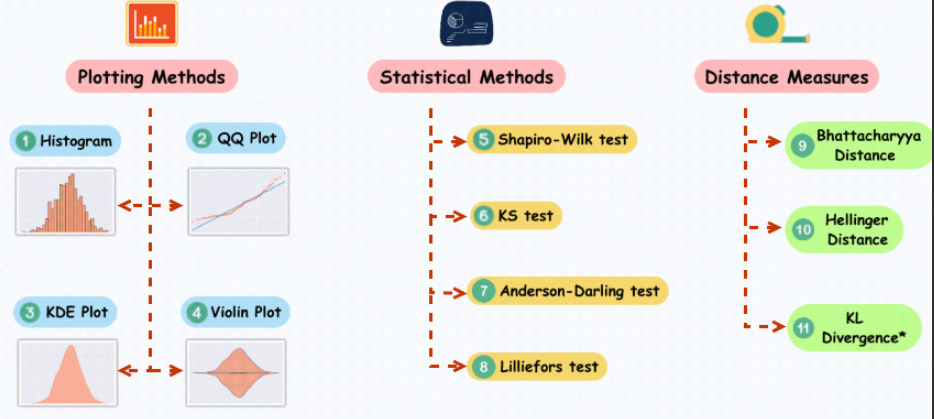
In the field of data science and machine learning, many models assume that the data is normally distributed, or that the data performs better under a normal distribution. For example, linear regression assumes that the residuals are normally distributed, and linear discriminant analysis (LDA) is derived based on assumptions such as normal distribution. Therefore, it is crucial for data scientists and machine learning practitioners to understand how to test data for normality.

This article aims to introduce 11 basic methods to test data Normality to help readers better understand the characteristics of data distribution and learn how to apply appropriate methods for analysis. In this way, the impact of data distribution on model performance can be better handled, and the process of machine learning and data modeling can be more convenient.
QQ plot (quantile-quantile plot) is a widely used method to check whether the data distribution conforms to the normal distribution. In the QQ plot, the quantiles of the data are compared with the quantiles of the standard normal distribution. If the data distribution is close to the normal distribution, the points on the QQ plot will be close to a straight line.
To demonstrate QQ Figure, The example code below generates a set of random data that follows a normal distribution. After running the code, you can see the QQ plot along with the corresponding normal distribution curve. By observing the distribution of points on the graph, you can initially judge whether the data is close to a normal distribution
import numpy as npimport scipy.stats as statsimport matplotlib.pyplot as plt# 生成一组随机数据,假设它们服从正态分布data = np.random.normal(0, 1, 1000)# 绘制QQ图stats.probplot(data, dist="norm", plot=plt)plt.title('Q-Q Plot')plt.show()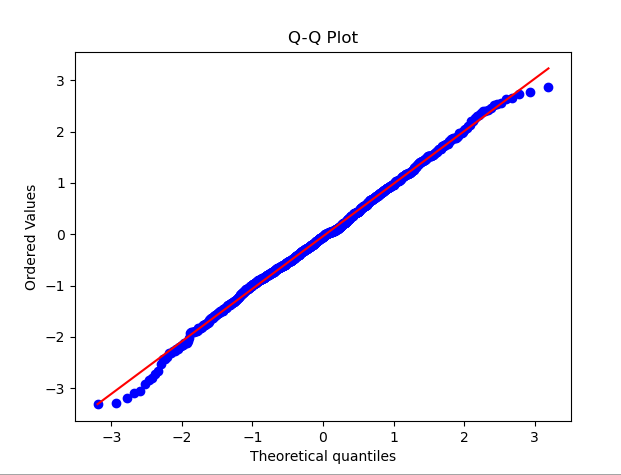
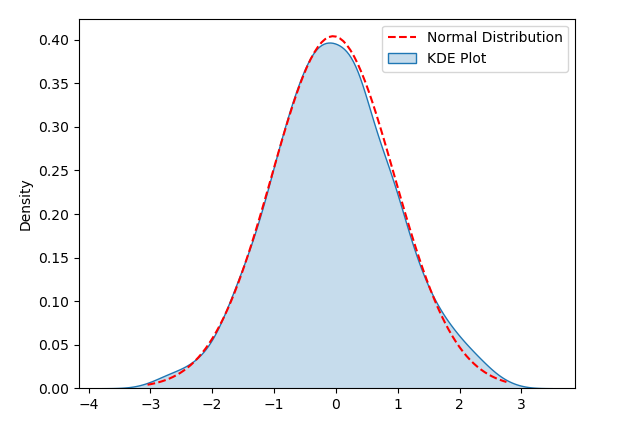
KDE (kernel density estimation) A graph is a method for visualizing the distribution of data and can help us detect the normality of the data. In the KDE plot, by estimating the density of the data and drawing it into a smooth curve, it helps us observe the distribution shape of the data
In order to demonstrate KDE Plot, the following sample code generates a set of normal distributions of random data. After running the code, you can see the KDE Plot and the corresponding normal distribution curve, and use visualization to detect whether the data distribution conforms to normality
import numpy as npimport seaborn as snsimport matplotlib.pyplot as plt# 生成随机数据np.random.seed(0)data = np.random.normal(loc=0, scale=1, size=1000)# 创建KDE Plotsns.kdeplot(data, shade=True, label='KDE Plot')# 添加正态分布曲线mu, sigma = np.mean(data), np.std(data)x = np.linspace(min(data), max(data), 100)y = (1/(sigma * np.sqrt(2 * np.pi))) * np.exp(-0.5 * ((x - mu) / sigma) ** 2)plt.plot(x, y, 'r--', label='Normal Distribution')# 显示图表plt.legend()plt.show()
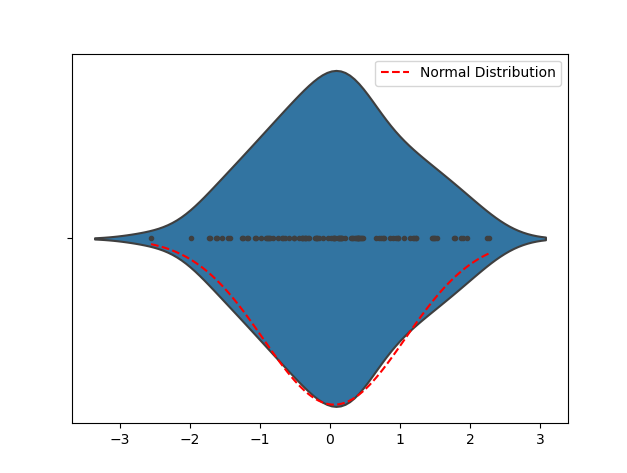
By observing Violin Plot, you can find the distribution shape of the data, and thus initially judge whether the data is close to a normal distribution. If the Violin Plot takes on a bell-curve-like shape, the data are probably approximately normally distributed. If your Violin Plot is heavily skewed or has multiple peaks, the data may not be normally distributed.
The following sample code is used to generate random data that obeys a normal distribution to demonstrate Violin Plot. After running the code, you can see the Violin Plot and the corresponding normal distribution curve. Detect the shape of the data distribution through visualization to initially determine whether the data is close to a normal distribution
import numpy as npimport seaborn as snsimport matplotlib.pyplot as plt# 生成随机数据np.random.seed(0)data = np.random.normal(loc=0, scale=1, size=100)# 创建 Violin Plotsns.violinplot(data, inner="points")# 添加正态分布曲线mu, sigma = np.mean(data), np.std(data)x = np.linspace(min(data), max(data), 100)y = (1/(sigma * np.sqrt(2 * np.pi))) * np.exp(-0.5 * ((x - mu) / sigma) ** 2)plt.plot(x, y, 'r--', label='Normal Distribution')# 显示图表plt.legend()plt.show()
Use histogram to Testing the normality of data distribution is also a common method. Histograms can help us intuitively understand the distribution of data, and can preliminarily determine whether the data is close to a normal distribution
import numpy as npimport matplotlib.pyplot as pltimport scipy.stats as stats# 生成一组随机数据,假设它们服从正态分布data = np.random.normal(0, 1, 1000)# 绘制直方图plt.hist(data, bins=30, density=True, alpha=0.6, color='g')plt.title('Histogram of Data')plt.xlabel('Value')plt.ylabel('Frequency')# 绘制正态分布的概率密度函数xmin, xmax = plt.xlim()x = np.linspace(xmin, xmax, 100)p = stats.norm.pdf(x, np.mean(data), np.std(data))plt.plot(x, p, 'k', linewidth=2)plt.show()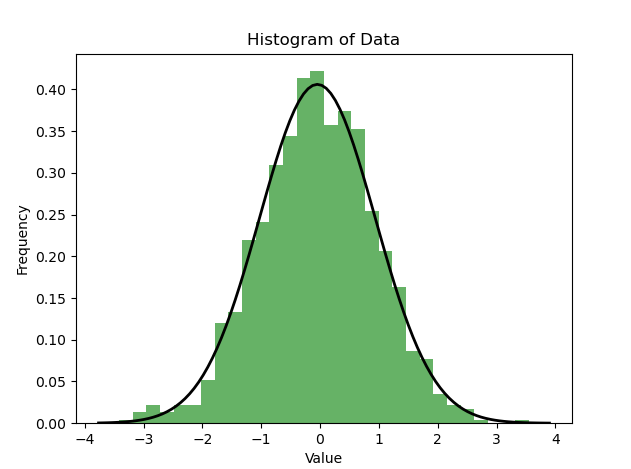
As shown in the figure above, if the histogram approximately presents If the distribution curve is similar to the corresponding normal distribution curve, then the data may conform to the normal distribution. Of course, visualization is only a preliminary judgment. If more precise detection is required, statistical methods such as normality testing can be used for analysis.
The Shapiro-Wilk test is a method used to test whether the data conforms to The statistical method of normal distribution is also called the W test. When performing the Shapiro-Wilk test, we usually focus on two main indicators:
Therefore, when the statistic W is close to 1 and the P value is greater than 0.05, we can conclude that the observed data satisfies the normal distribution.
In the following code, a set of random data obeying the normal distribution is first generated, and then the Shapiro-Wilk test is performed to obtain the test statistic and P value. Based on the comparison between the P value and the significance level, you can determine whether the sample data comes from a normal distribution.
from scipy import statsimport numpy as np# 生成一组服从正态分布的随机数据data = np.random.normal(0, 1, 100)# 执行Shapiro-Wilk检验stat, p = stats.shapiro(data)print('Shapiro-Wilk Statistic:', stat)print('P-value:', p)# 根据P值判断正态性alpha = 0.05if p > alpha:print('样本数据可能来自正态分布')else:print('样本数据不符合正态分布')
KS检验(Kolmogorov-Smirnov检验)是一种用于检验数据是否符合特定分布(例如正态分布)的统计方法。它通过计算观测数据与理论分布的累积分布函数(CDF)之间的最大差异来评估它们是否来自同一分布。其基本步骤如下:
Python中使用KS检验来检验数据是否符合正态分布时,可以使用Scipy库中的kstest函数。下面是一个简单的示例,演示了如何使用Python进行KS检验来检验数据是否符合正态分布。
from scipy import statsimport numpy as np# 生成一组服从正态分布的随机数据data = np.random.normal(0, 1, 100)# 执行KS检验statistic, p_value = stats.kstest(data, 'norm')print('KS Statistic:', statistic)print('P-value:', p_value)# 根据P值判断正态性alpha = 0.05if p_value > alpha:print('样本数据可能来自正态分布')else:print('样本数据不符合正态分布')
Anderson-Darling检验是一种用于检验数据是否来自特定分布(例如正态分布)的统计方法。它特别强调观察值在分布尾部的差异,因此在检测极端值的偏差方面非常有效
下面的代码使用stats.anderson函数执行Anderson-Darling检验,并获取检验统计量、临界值以及显著性水平。然后通过比较统计量和临界值,可以判断样本数据是否符合正态分布
from scipy import statsimport numpy as np# 生成一组服从正态分布的随机数据data = np.random.normal(0, 1, 100)# 执行Anderson-Darling检验result = stats.anderson(data, dist='norm')print('Anderson-Darling Statistic:', result.statistic)print('Critical Values:', result.critical_values)print('Significance Level:', result.significance_level)# 判断正态性if result.statistic <p style="text-align:center;"><img src="https://img.php.cn/upload/article/000/887/227/170255826239547.png" alt="11 basic methods for determining the normality of data distributions"></p><h4>8.Lilliefors检验</h4><p>Lilliefors检验(也被称为Kolmogorov-Smirnov-Lilliefors检验)是一种用于检验数据是否符合正态分布的统计检验方法。它是Kolmogorov-Smirnov检验的一种变体,专门用于小样本情况。与K-S检验不同,Lilliefors检验不需要假定数据的分布类型,而是基于观测数据来评估是否符合正态分布</p><p>在下面的例子中,我们使用lilliefors函数进行Lilliefors检验,并获得了检验统计量和P值。通过将P值与显著性水平进行比较,我们可以判断样本数据是否符合正态分布</p><pre class="brush:php;toolbar:false">import numpy as npfrom statsmodels.stats.diagnostic import lilliefors# 生成一组服从正态分布的随机数据data = np.random.normal(0, 1, 100)# 执行Lilliefors检验statistic, p_value = lilliefors(data)print('Lilliefors Statistic:', statistic)print('P-value:', p_value)# 根据P值判断正态性alpha = 0.05if p_value > alpha:print('样本数据可能来自正态分布')else:print('样本数据不符合正态分布')
距离测量(Distance measures)是一种有效的测试数据正态性的方法,它提供了更直观的方式来比较观察数据分布与参考分布之间的差异。
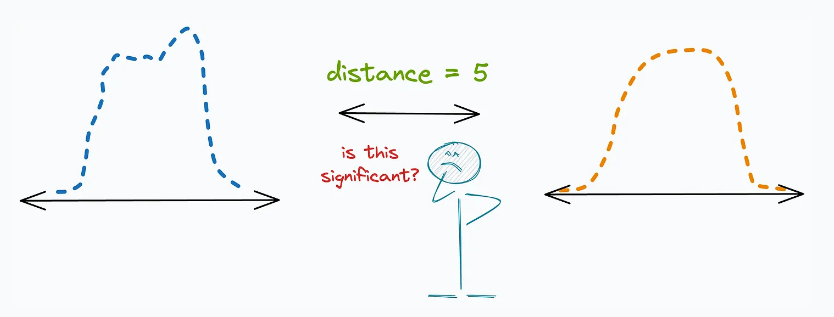
下面是一些常见的距离测量方法及其在测试正态性时的应用:
(1) "巴氏距离(Bhattacharyya distance)"的定义是:
(2) 「海林格距离(Hellinger distance)」:
(3) "KL 散度(KL Divergence)":
运用这些距离测量方法,我们能够比对观测到的分布与多个参考分布之间的差异,进而更好地评估数据的正态性。通过找出与观察到的分布距离最短的参考分布,我们可以更精确地判断数据是否符合正态分布
The above is the detailed content of 11 basic methods for determining the normality of data distributions. For more information, please follow other related articles on the PHP Chinese website!
 Unable to connect to the internet
 what node can do
 javac is not recognized as an internal or external command or an operable program. How to solve the problem?
 virtual digital currency
 What are the core technologies necessary for Java development?
 How to solve webstorm crash
 What is the difference between legacy and uefi?
 Folder becomes exe


