Monitoring is commonly known as the "third eye". It is a system that we deal with almost every day. As the saying goes: no monitoring, no operation and maintenance. The status of monitoring is self-evident, especially in operation and maintenance. In the era of automation, traditional operation and maintenance, DevOps, or SRE, monitoring is a necessary skill.
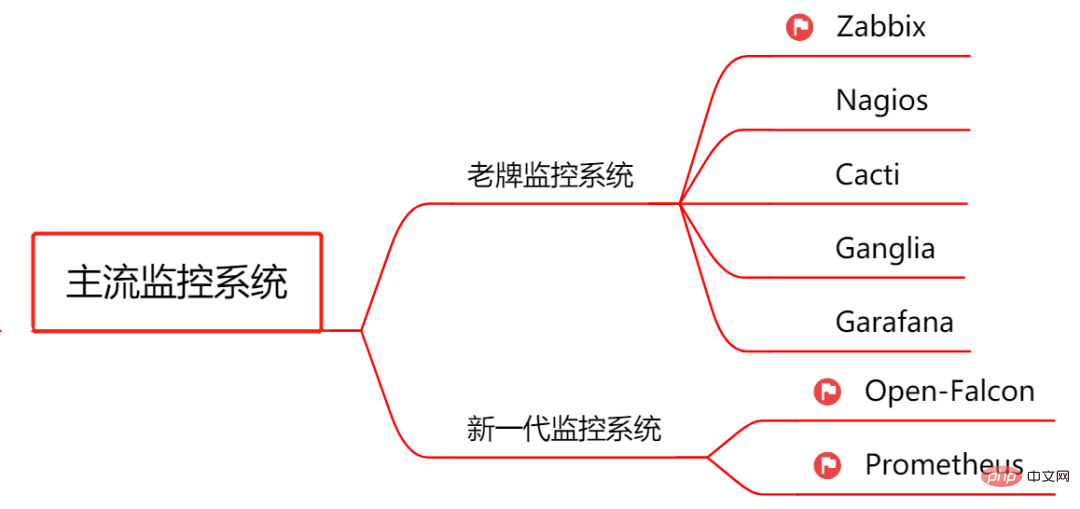
Let’s first get to know the mainstream open source monitoring systems, Zabbix, Open-Falcon, Prometheus, etc. Today we will briefly introduce them[ Zabbix] [Prometheus] [Cacti] [Nagios] [Garafana] and other 5 mainstream monitoring systems for your reference when choosing. In addition, I also share with you the learning materials for these five monitoring systems, so that you can freely learn and refer to them.
All information has been organized into compressed packages
[See the end of the article for information collection methods! 】
##
Prometheus is an open source monitoring system officially released by former Google employees in 2015. Developed using Go language. Not only does it have a cool name, but it also has strong support from Google and k8s, and the open source community is extremely popular.
This Prometheus official Chinese document is suitable for beginners to get started and for students with a certain foundation to advance. This document is divided into seven parts. It starts with the most basic introduction to the installation and startup of Prometheus, and compares the advantages and disadvantages of different monitoring systems, such as Graphite, OpenTSDB, Nagios, etc. In addition, it also includes some practical projects: Grafana combined with Prometheus for visualization, Instrumenting, writing customer libraries, pushing metrics, etc. In short, it is full of useful information!
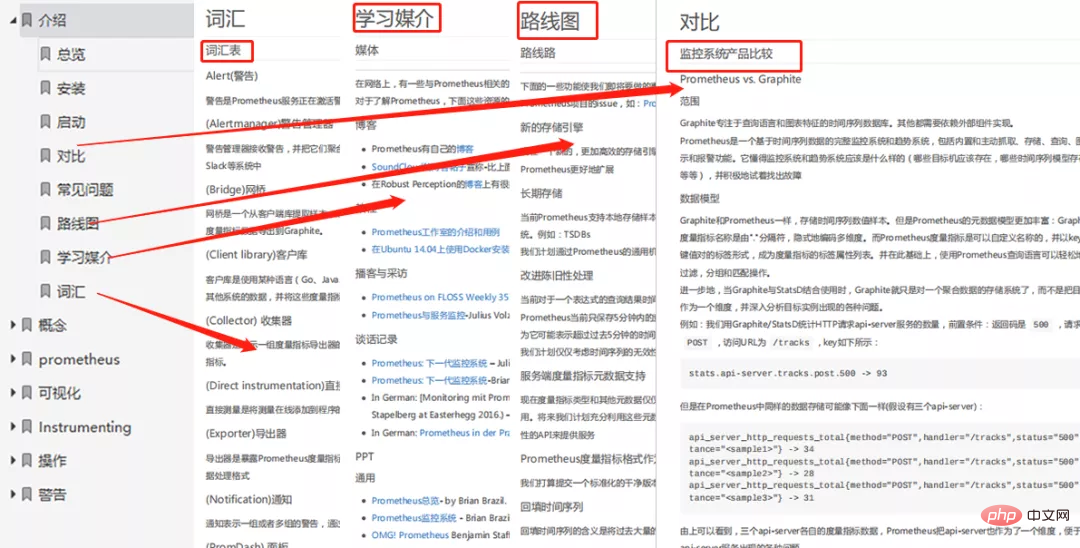
Part One: LearnPrometheusPreparation #What is Prometheus? What are the applicable scenarios of Prometheus? PrometheusInstallation and startup, detailed comparison of monitoring system products, this section also lists the Prometheus learning roadmap and vocabulary overview, and recommends some authoritative Prometheus learning medium. 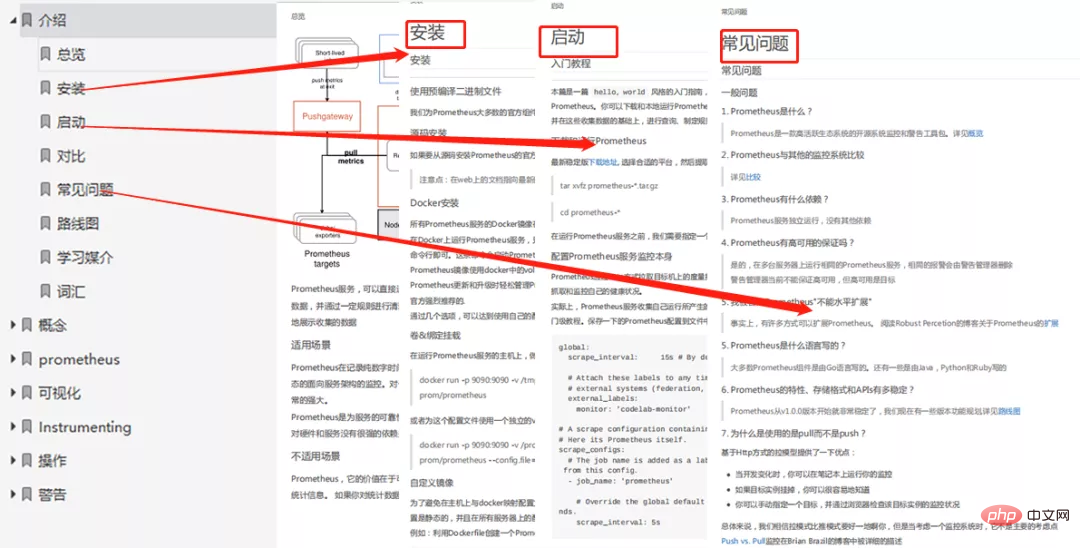
second Part: Detailed explanation of important concepts of PrometheusIn this part, some basic concepts are introduced in detail. Only by studying this part can we truly understand the working principle of Prometheus.
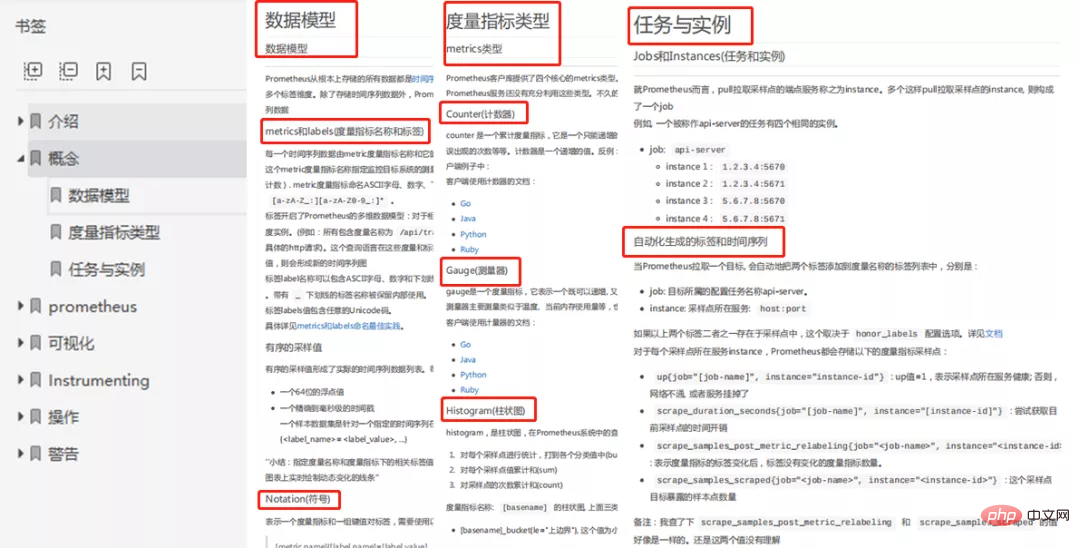
Part 3: Query and startup of PrometheusThe next step starts slowly Let’s slowly enter the practical training part. The third part mainly talks about the query and startup of Prometheus,basic concept practical training, and really enters the practical part!
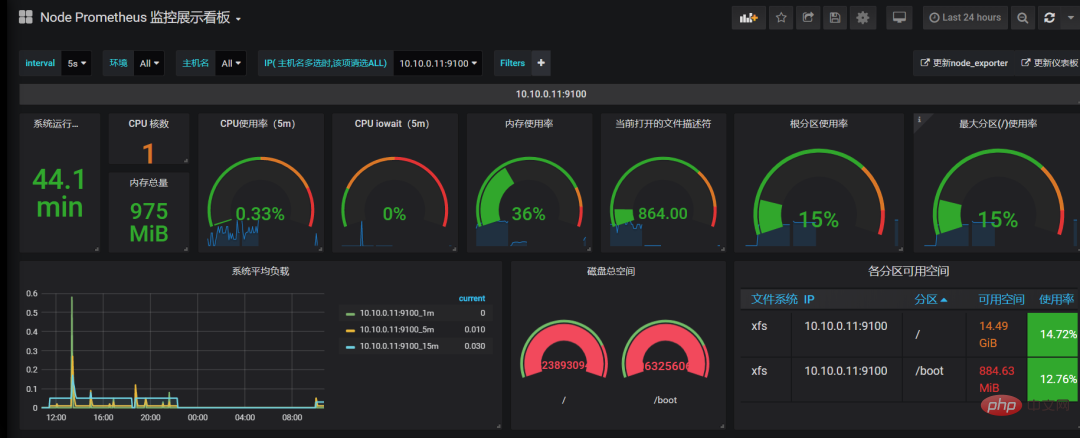
Part 4: Visualization
The main content of this part is to realize the visualization of Prometheus. Teach you step by step how to create a Prometheus Graph using Grafana! 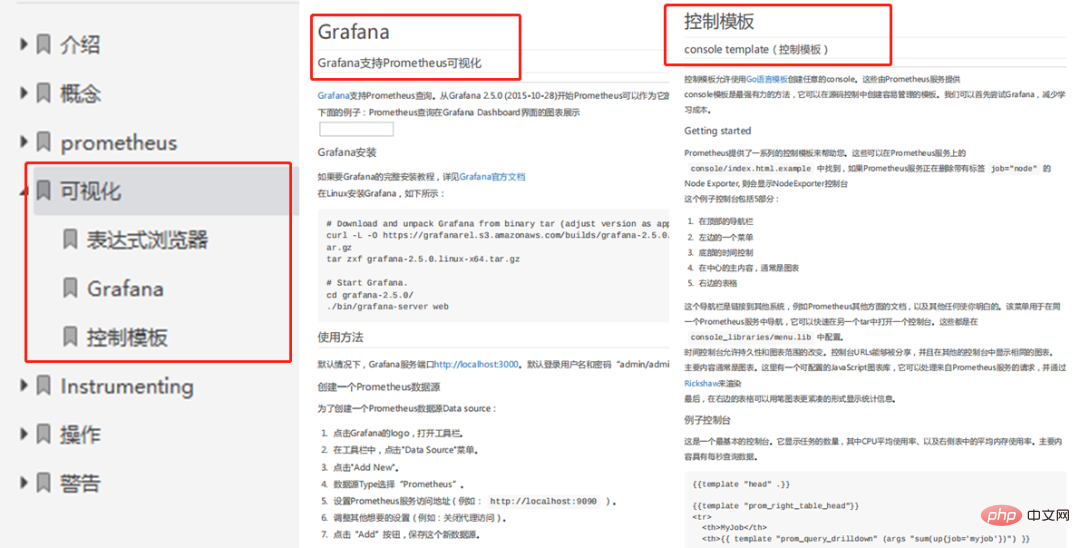
*Statement: The information comes from the Internet, for details, please see the official website https://prometheus.io/, The PDF is only for learning and communication, no infringement will be deleted
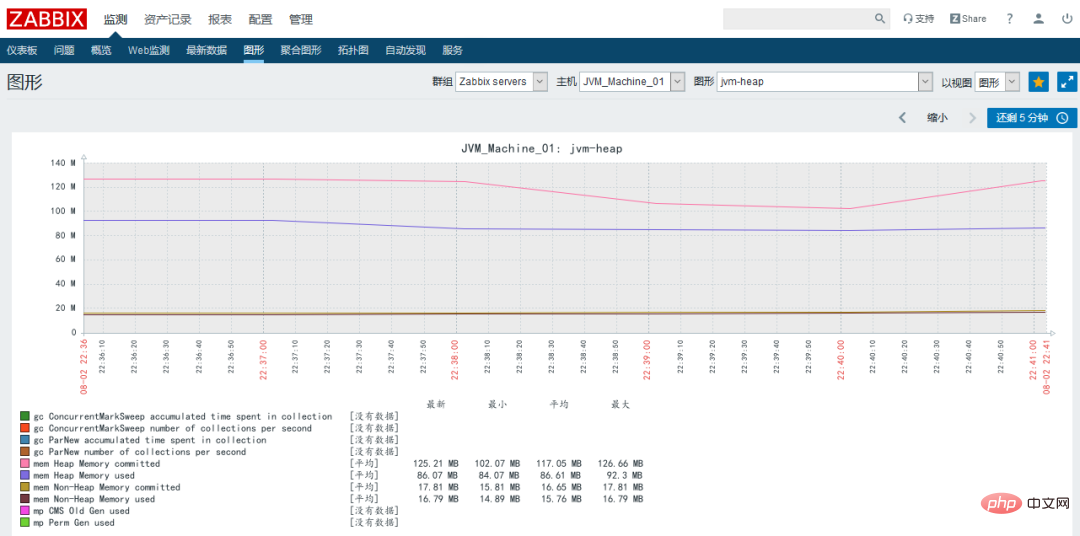
##Zabbix is a Enterprise-grade, open source, distributed monitoring suite used to monitor the availability and performance of IT infrastructure.
Compared with the above various monitoring systems, Zabbix stands out among the others with its powerful advantages. Its rich functions, scalable capabilities, secondary development capabilities and simple and easy-to-use features greatly enable readers to reduce costs. With no learning costs, you can easily build your own monitoring system.
The Zabbix practical document shared today was compiled by Marco himself and has a total of 141 pages. The content is detailed, theoretical and practical, and full of useful information. I believe that everyone will have a deeper understanding of zabbix after reading it.
- ##1. Introduction to monitoring services
- 2. Zabbix planning and deployment
- 3. Basics of getting started with zabbix monitoring
- ##5. Zabbix monitoring case practice
- 6. Zabbix event notification mechanism
- 7. Zabbix automated operation and maintenance
Monitoring service introduction
-
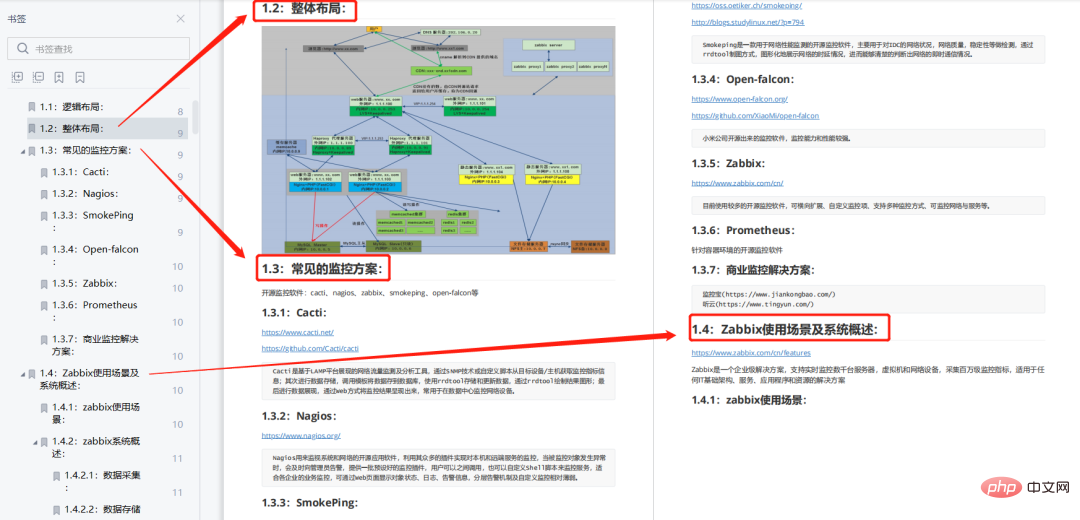
- Common monitoring solutions
- Zabbix usage scenarios and system overview
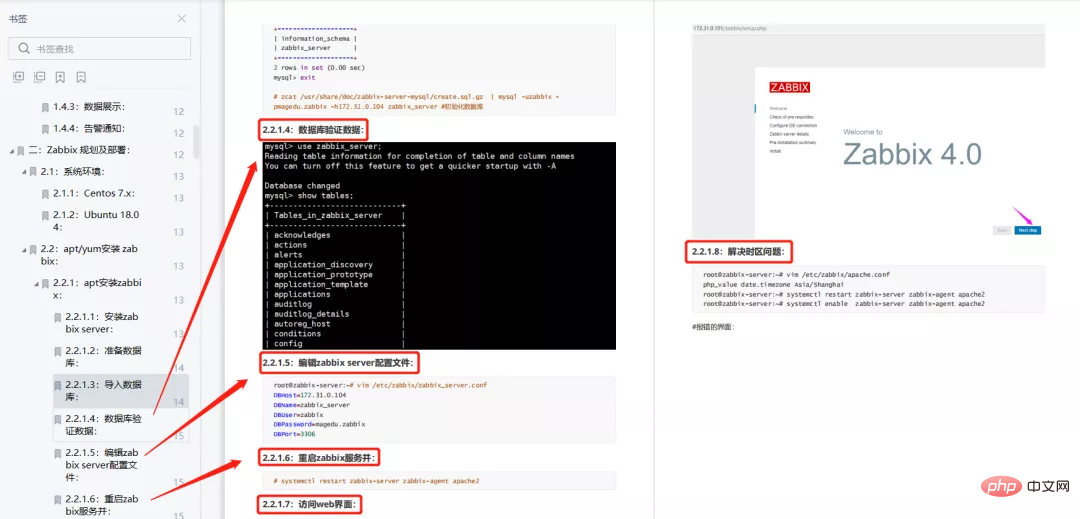
 zabbix planning and deployment
- Compile and install zabbix
- Web interface Chinese menu environment
- Monitoring items and garbled codes
- zabbix Detailed explanation of server configuration file
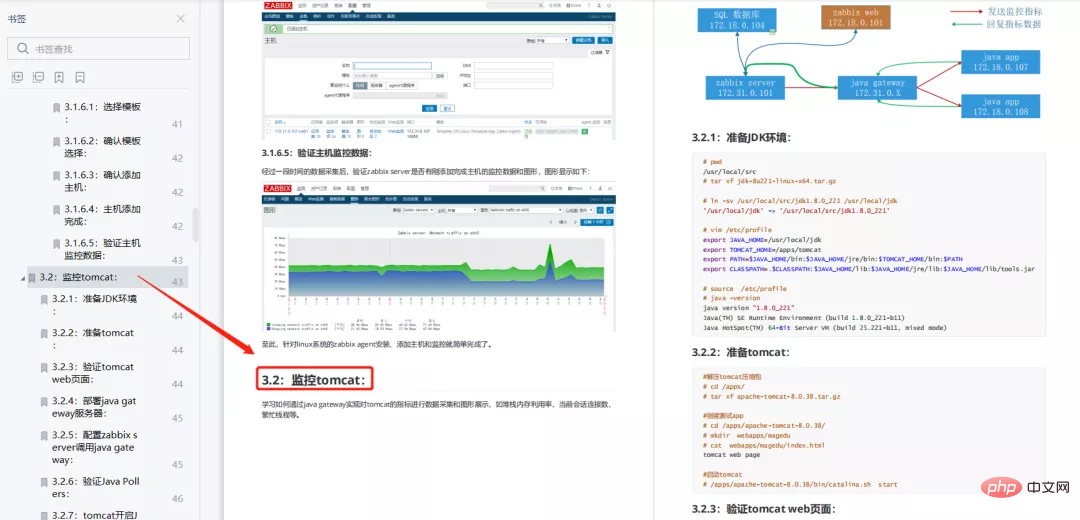
 Zabbix monitoring entry basics
- zabbix active and passive monitoring mode
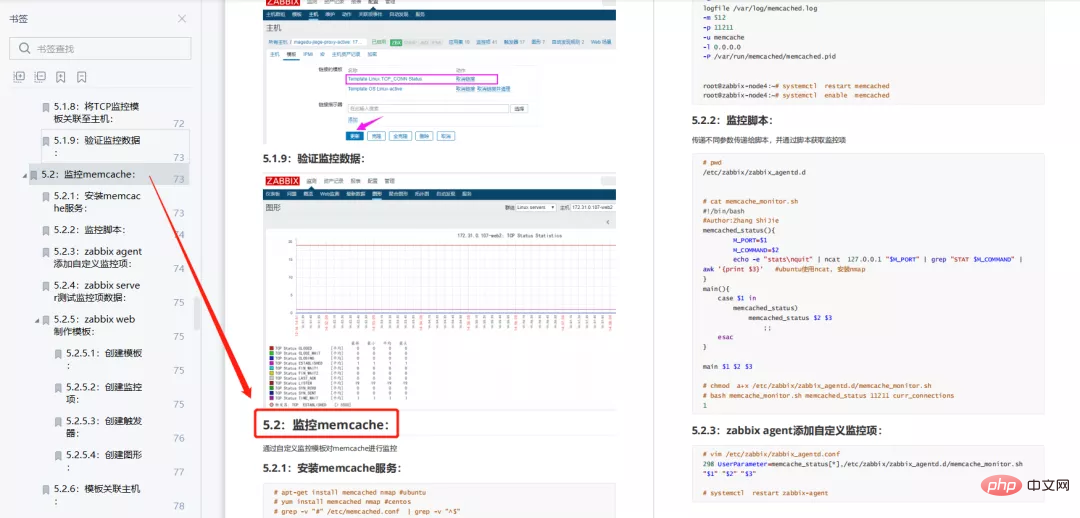
##zabbix monitoring case Actual combat
- Monitoring Linux TCP connection status
- Custom port and process monitoring
- Fault self-healing function
- Customized basic monitoring template
- Combined with pyhton script monitoring case
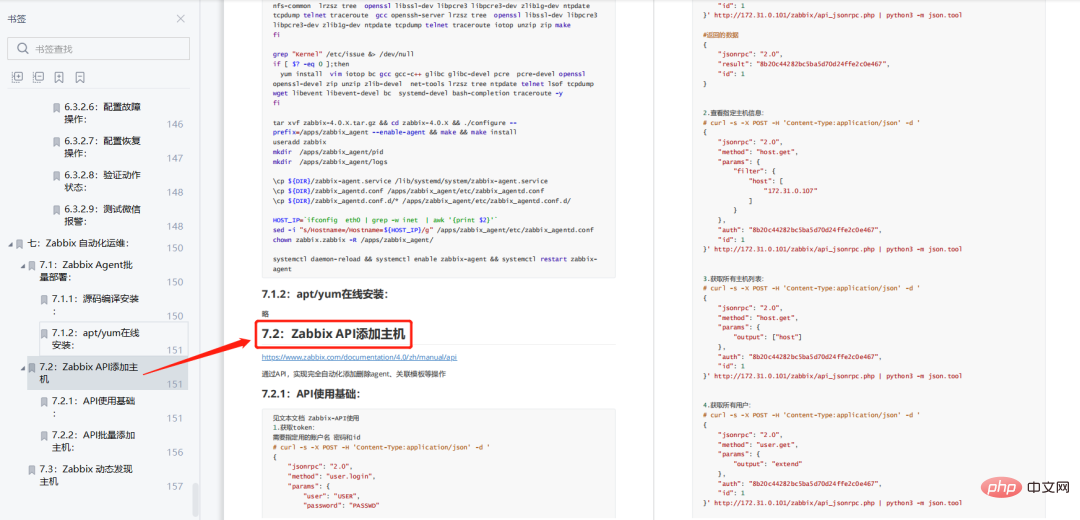
##zabbix automated operation and maintenance
- ## Zabbix Agent batch deployment
- Zabbix API add host
- Zabbix dynamic discovery of host
##Cacti is a network developed based on PHP, MySQL, SNMP and RRDTool Traffic monitoring graphical analysis tool. Simply put, Cacti is a PHP program. cacti is a very old monitoring tool. In fact, it is more suitable to say that it is a traffic monitoring tool. It is more accurate in traffic monitoring, but it has many shortcomings. The pictures are not good-looking and it does not support distribution.
Regarding the Cacti monitoring system, today I will share a user manual. Including [Use templates to add basic monitoring items for response hosts][Add and monitor custom scripts]
and other contents. 
*Statement: The information comes from the Internet, PDF is only for learning and communication, no infringement or deletion
Nagios is an open source free network monitoring tool that can effectively monitor Windows, Linux and Unix hosts status, network devices such as switches and routers, printers, etc. Introduction to Nagios; working principle of Nagios; Nagios experimental environment and installation; Nagios configuration; Nagios startup and stop; Nagios view preliminary configuration; use NRPE to monitor "local" on Linux Information, etc.
*Statement: The information comes from the Internet, the PDF is only for learning and communication, no infringement or deletion
##This is a big guy The notes summarized in the process of using Grafana are highly recommended to read and study!
Including various problems that beginners may encounter during the learning process, I summarized Grafana2 based on my own experience The use of .1.3, I hope it can be helpful to everyone.
*Statement: The information comes from the Internet. The PDF is only for learning and exchange. No infringement or deletion
The above is the detailed content of This article is enough for monitoring systems! Common monitoring tutorials such as Zabbix and Prometheus. For more information, please follow other related articles on the PHP Chinese website!


![[Web front-end] Node.js quick start](https://img.php.cn/upload/course/000/000/067/662b5d34ba7c0227.png)


