First, write a basic python function for various performance tests later.
def base_func():
    for n in range(10000):
print('当前n的值是:{}'.format(n))memory_profiler is a non-standard library of python, so pip is used to install it here. It can monitor processes, understand memory usage, and more.
pip install memory_profiler
After installing the memory_profiler library, directly use annotations to test.
from memory_profiler import profile
@profile
def base_func1():
    for n in range(10000):
        print('当前n的值是:{}'.format(n))
base_func1()
# Line #    Mem usage    Increment  Occurrences   Line Contents
# =============================================================
#     28     45.3 MiB     45.3 MiB           1   @profile
#     29                                         def base_func():
#     30     45.3 MiB      0.0 MiB       10001       for n in range(10000):
# 31 45.3 MiB 0.0 MiB 10000 print('当前n的值是:{}'.format(n))Judging from the returned data results, 45.3 MiB of memory is used to execute the current function.
Timeit is a built-in module of Python that can test the code running time of a cell. Since it is a built-in module, it does not need to be installed separately.
import timeit
def base_func2():
    for n in range(10000):
        print('当前n的值是:{}'.format(n))
res = timeit.timeit(base_func2,number=5)
print('当前的函数的运行时间是:{}'.format(res))
# 当前的函数的运行时间是:0.9675800999999993According to the return result of the above function, the running time of the function is 0.96 seconds.
If you only need to detect the local running time of the function, you can use line_profiler, which can detect the running time of each line of code.
Line_profiler is a non-standard library of python. Use pip to install it.
pip install line_profiler
The easiest way to use it is to directly add the functions that need to be tested.
def base_func3():
    for n in range(10000):
        print('当前n的值是:{}'.format(n))
from line_profiler import LineProfiler
lp = LineProfiler()
lp_wrap = lp(base_func3)
lp_wrap()
lp.print_stats()
# Line #      Hits         Time  Per Hit   % Time  Line Contents
# ==============================================================
#     72                                           def base_func3():
#     73     10001     162738.0     16.3      4.8      for n in range(10000):
# 74 10000 3207772.0 320.8 95.2 print('当前n的值是:{}'.format(n))You can see the running time and proportion of each line of code from the running results. Note that the time unit here is subtle.
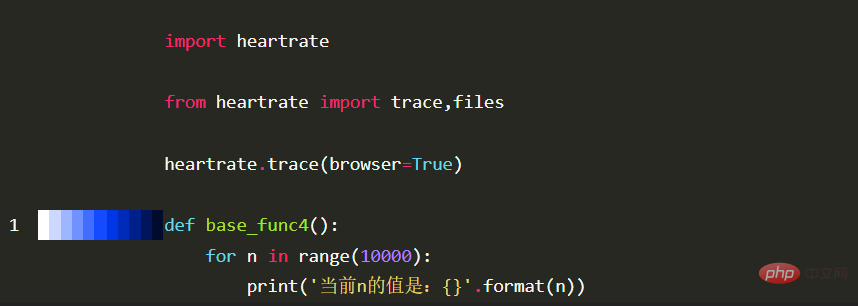
The most recommended thing about heartrate is that it can detect the execution process of the program on the web page just like detecting heart rate. At the same time, it is also a non-standard library and can be installed using pip.
pip install heartrate
import heartrate
heartrate.trace(browser=True)
def base_func4():
    for n in range(10000):
print('当前n的值是:{}'.format(n))After running, the console prints the following log:
#  * Serving Flask app "heartrate.core" (lazy loading)
#  * Environment: production
#    WARNING: This is a development server. Do not use it in a production deployment.
#    Use a production WSGI server instead.
#  * Debug mode: off
and automatically opens the browser address: http://127.0.0.1:9999

The above is the detailed content of How to use performance testing tools such as python function running memory time. For more information, please follow other related articles on the PHP Chinese website!


