
Three-dimensional image technology is one of the most advanced computer display technologies in the world. Any ordinary computer only needs to install a plug-in to present three-dimensional products in a web browser. It is not only lifelike, And it can dynamically display the product combination process, which is especially suitable for remote browsing.
The three-dimensional images are visually distinct and colorful, with strong visual impact, allowing viewers to stay in the scene for a long time and leaving a deep impression. The three-dimensional pictures give people a real and lifelike feeling, the characters are ready to be seen, and they have an immersive feeling, which has a high artistic appreciation value.
First, you need to install the Matplotlib library, you can use pip:
pip install matplotlib
Assume that the matplotlib tool package has been installed.
Use matplotlib.figure.Figure to create a plot frame:
import matplotlib.pyplot as plt from mpl_toolkits.mplot3d import Axes3D fig = plt.figure() ax = fig.add_subplot(111, projection='3d')
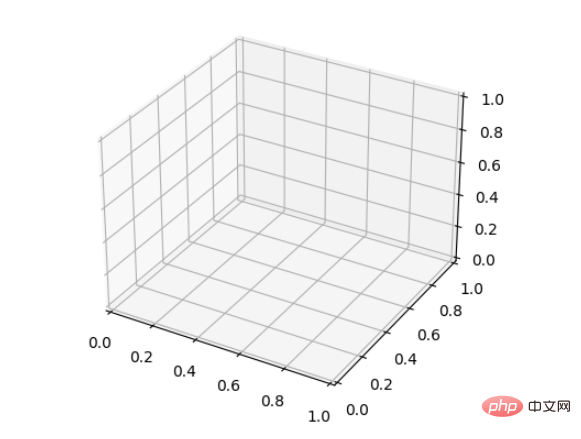
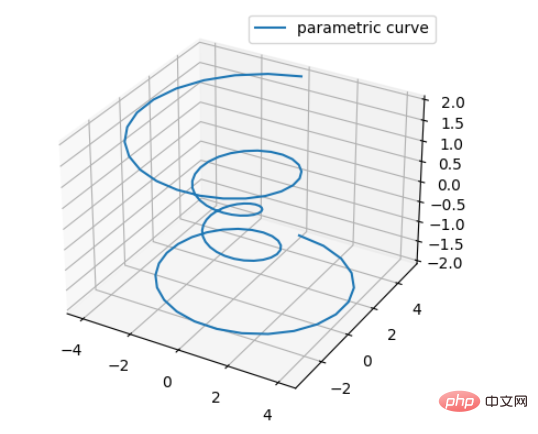
Basic usage: ax.plot(x,y,z,label=' ')
The code is as follows:
import matplotlib as mpl from mpl_toolkits.mplot3d import Axes3D import numpy as np import matplotlib.pyplot as plt mpl.rcParams['legend.fontsize'] = 10 fig = plt.figure() ax = fig.add_subplot(projection='3d') theta = np.linspace(-4 * np.pi, 4 * np.pi, 100) z = np.linspace(-2, 2, 100) r = z ** 2 + 1 x = r * np.sin(theta) y = r * np.cos(theta) ax.plot(x, y, z, label='parametric curve') ax.legend()
The effect is as follows:
Basic syntax:
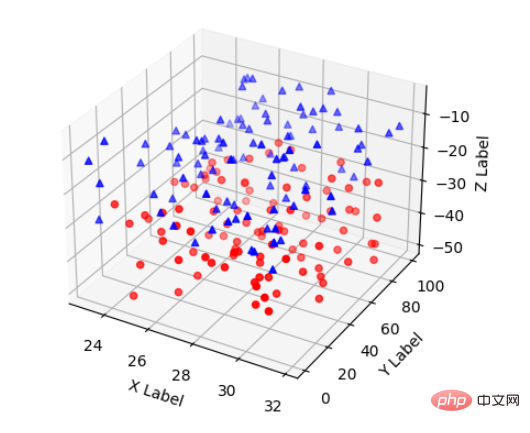
ax.scatter(xs, ys, zs, s=20, c=None, depthshade=True, *args , *kwargs)
The code is roughly:
xs,ys,zs: input data;
s: size of scatter point
c: color, if c = 'r’ it is red;
depthshase: transparency, True is Transparent, the default is True, False is opaque
*args and so on are expansion variables, such as maker = ‘o’, then the scatter result is the shape of ’o‘
Sample code:
from mpl_toolkits.mplot3d import Axes3D import matplotlib.pyplot as plt import numpy as np def randrange(n, vmin, vmax): ''' Helper function to make an array of random numbers having shape (n, ) with each number distributed Uniform(vmin, vmax). ''' return (vmax - vmin)*np.random.rand(n) + vmin fig = plt.figure() ax = fig.add_subplot(111, projection='3d') n = 100 # For each set of style and range settings, plot n random points in the box # defined by x in [23, 32], y in [0, 100], z in [zlow, zhigh]. for c, m, zlow, zhigh in [('r', 'o', -50, -25), ('b', '^', -30, -5)]: xs = randrange(n, 23, 32) ys = randrange(n, 0, 100) zs = randrange(n, zlow, zhigh) ax.scatter(xs, ys, zs, c=c, marker=m) ax.set_xlabel('X Label') ax.set_ylabel('Y Label') ax.set_zlabel('Z Label') plt.show()
Effect:
from mpl_toolkits.mplot3d import axes3d import matplotlib.pyplot as plt fig = plt.figure() ax = fig.add_subplot(100, projection='3d') # Grab some test data. X, Y, Z = axes3d.get_test_data(0.12) # Plot a basic wireframe. ax.plot_wireframe(X, Y, Z, rstride=10, cstride=10) plt.show()
4. Tri-Surface plots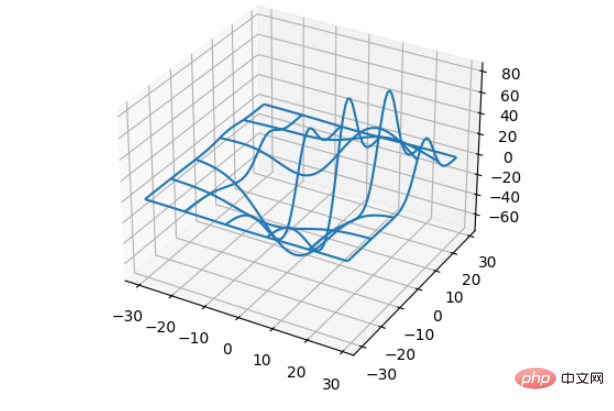
from mpl_toolkits.mplot3d import Axes3D import matplotlib.pyplot as plt import numpy as np n_radii = 8 n_angles = 36 radii = np.linspace(0.125, 1.0, n_radii) angles = np.linspace(0, 2*np.pi, n_angles, endpoint=False) angles = np.repeat(angles[..., np.newaxis], n_radii, axis=1) # points in the (x, y) plane. x = np.append(0, (radii*np.cos(angles)).flatten()) y = np.append(0, (radii*np.sin(angles)).flatten()) z = np.sin(-x*y) fig = plt.figure() ax = fig.add_subplot(projection='3d') ax.plot_trisurf(x, y, z, linewidth=0.2, antialiased=True) plt.show()
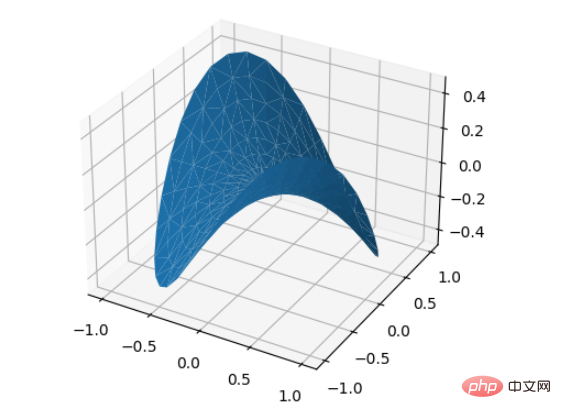 Use scatter generates a random scatter plot.
matplotlib.pyplot.scatter(x, y,
s=None, #Scatter size array scalarc=None, #Color sequence array, sequencemarker=None, #Point style
cmap=None, #colormap color style
norm=None, #Normalization Normalized color camp
vmin=None, vmax=None, #corresponding to the normalized range above
alpha=None, #transparency
linewidths=None, #linewidth
verts=None,
# edgecolors =None, #Edge color
data=None,
**kwargs
)
Sample code:Effect:import numpy as np import matplotlib.pyplot as plt #定义坐标轴 fig4 = plt.figure() ax4 = plt.axes(projection='3d') #生成三维数据 xx = np.random.random(20)*10-5 #取100个随机数,范围在5~5之间 yy = np.random.random(20)*10-5 X, Y = np.meshgrid(xx, yy) Z = np.sin(np.sqrt(X**2+Y**2)) #作图 ax4.scatter(X,Y,Z,alpha=0.3,c=np.random.random(400),s=np.random.randint(10,20,size=(20, 20))) #生成散点.利用c控制颜色序列,s控制大小 plt.show()Copy after loginThe above is the detailed content of How to create a three-dimensional line chart using Python and Matplotlib. For more information, please follow other related articles on the PHP Chinese website!


