
The Linux crash log is in "/var/log/"; the log log of "/var/log/" under Linux includes message, kernel error log demsg, etc.; the sa record records cpu, Performance files for memory and other operations; use the sa file to view the CPU and memory conditions during a crash.

#The operating environment of this tutorial: linux5.9.8 system, Dell G3 computer.
Where are the Linux crash logs?
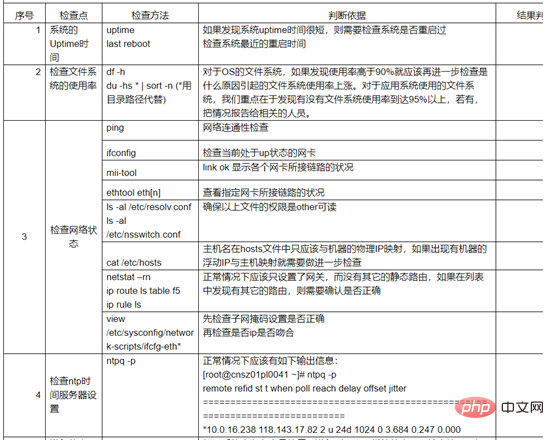
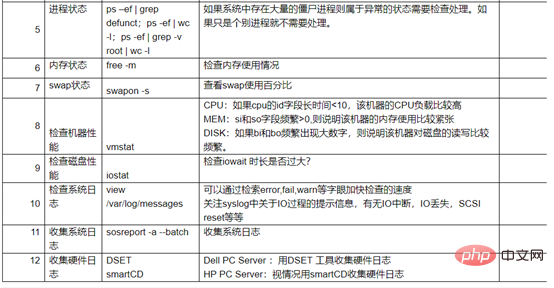
Linux host downtime troubleshooting ideas
Cause analysis
Server classification, web server, database server, file server, middleware, Other servers.
Web server analysis: common web applications apache, nginx, IIS, etc.
There are many reasons for downtime, such as CPU, memory, IO disk, application BUG, kernel BUG, hardware, etc.
System and kernel version

Process
1. View the downtime time record, historical login and restart time
last reboot

last -F | grep crash

Check the history login for any abnormal users
last
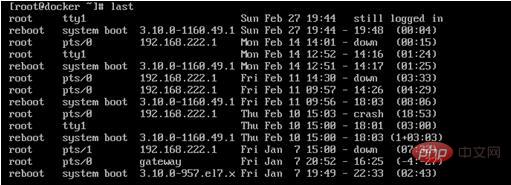
2. First Check the system log. For example, the log log under /var/log/ under Linux includes message, kernel error log demsg, etc. The sa record is a performance file that records the operation of CPU, memory, etc., and records the running status of the CPU during operation as shown in the figure. Show.
Use the sa file to check the CPU status during the crash

Use the sa file to check the memory status during the crash
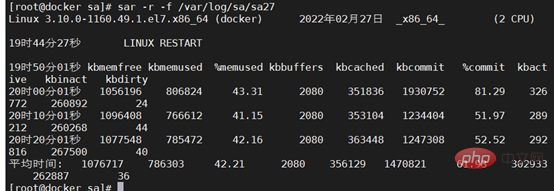
The amount of logs is often very large
You can also perform fuzzy queries, such as
View error reports
tail -200 /var/log/messages |grep "Error" cat /var/log/dmesg |grep "Error"
View kernel crash logs
tail -200 /car/log/messages |grep "crash"
Check whether When OOM occurs, the process will usually be killed by kill
cat /var/log/messages |grep -i "kill"
You can also check the logs during the downtime period, check the logs at 15:00 on December 11th
cat /vat/log/messages |grep "Feb 11 15*"
3. Check the memory usage
free -m, check the usage of swap, remaining memory and cache. If swap is used and available is not enough, you also need to check the parameter cat /proc/sys/vm/swappiness. If it is set to 0, it means there is not enough memory.

4. View io and file system using
to observe idle and iowait. The cache is used when reading and writing to the disk, which is generally 40% of the system memory. However, there is a buffering time of 120 seconds in the middle. When the cache is about to be used up, it will wait for 120 seconds before writing to the disk. When reading and writing are frequent, Sometimes it is easy to cause hanging.

# Check the IO read and write speed. If it is very slow, it means there is a bottleneck in disk performance.

File system usage
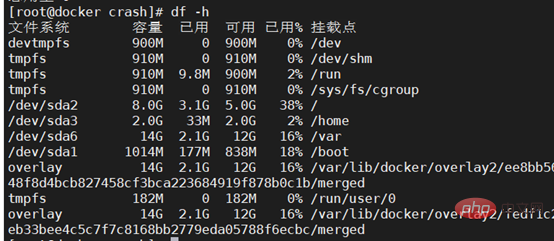
5. Check the security log
The security log is /var/ log/secure, check the history record to see if someone logged in to the host and took malicious actions, such as shutting down.

6. Use kdump and crash tools to analyze the kernel
Check that the kdump service is enabled on the server, and find the vmcore file generated that day in the /var/crash directory. Use the crash tool to analyze the vmcore file.
Kdump is used to dump memory images. It can not only dump the memory image to the local hard disk, but also dump the memory image to devices on different machines through NFS, SSH and other protocols.
Kdump is divided into two components: Kexec and Kdump.
Kexec is a quick startup tool for the kernel that allows a new kernel to be started in the context of a running kernel (production kernel) without going through time-consuming BIOS detection, making it easier for kernel developers to kernel for debugging.
Kdump is an effective memory dump tool. After enabling Kdump, the production kernel will reserve a part of the memory space for quickly booting to a new kernel through Kexec when the kernel crashes. This process does not require a restart. system so that a memory image of the crashed production kernel can be dumped.
7. Check service logs and monitoring software
If you can find the occupancy of the process during the downtime, you can check its logs based on the services with abnormal occupancy.
Service logs generally include databases and web services, middleware, frameworks, etc.
You can also view the historical record images of the monitoring software and find the image analysis of peak points and downtime points as shown below.
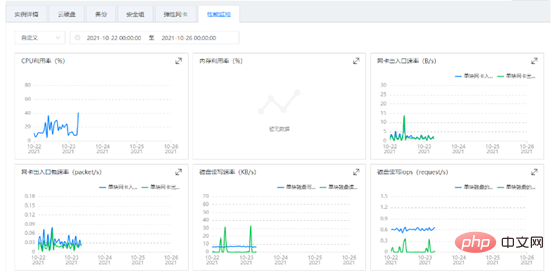
8. Summary
There are many reasons for system downtime, we need to carefully analyze according to the process,
Related recommendations: "Linux Video Tutorial"
The above is the detailed content of Where is the linux crash log?. For more information, please follow other related articles on the PHP Chinese website!