This article will introduce to you how to use xhprof analysis in php7. It has certain reference value. Friends in need can refer to it. I hope it will be helpful to everyone.

This is a pure document. If you need it in the future, you can look it up at any time and use xhprof for analysis to facilitate code testing and comparative analysis (supports php7).
docker run -it -p 80:80 -v /Users/xxx/Desktop/xhprof:/data phalcon /bin/bash
Copy code
There are quite a few xhprofs that support php7, we use github.com/longxinH here /xh… This project.
1.1 Pull project
git clone https://github.com/longxinH/xhprof.git
Copy code
1.2 Install project
cd xhprof/extension/
/usr/server/php7/bin/phpize
./configure --with-php-config=/usr/server/php7/bin/php-config
make && make install
1.3 Add xhprof.so extension
Finish execution , we need to introduce this so file into the php.ini configuration
Check the php.ini file path
/usr/server/php7/bin/php --ini

Configuration File (php.ini) Path: /usr/server/php7/etc
Loaded Configuration File: /usr/server/php7/etc/php.ini
Scan for additional .ini files in: /usr/server/php7/etc/php
Additional .ini files parsed: (none)
编辑 /usr/server/php7/etc/php.ini
[Xhprof]
extension=xhprof.so
xhprof.output_dir=/data/logs
Restart php-fpm.
We embed the following code in front of the logic to be monitored
\xhprof_enable();
......
$order = new OrderAdepter();
$result = $order->getUserOrderByOrderNo(123);
......
$xhprof_data = \xhprof_disable();
print_r($xhprof_data);
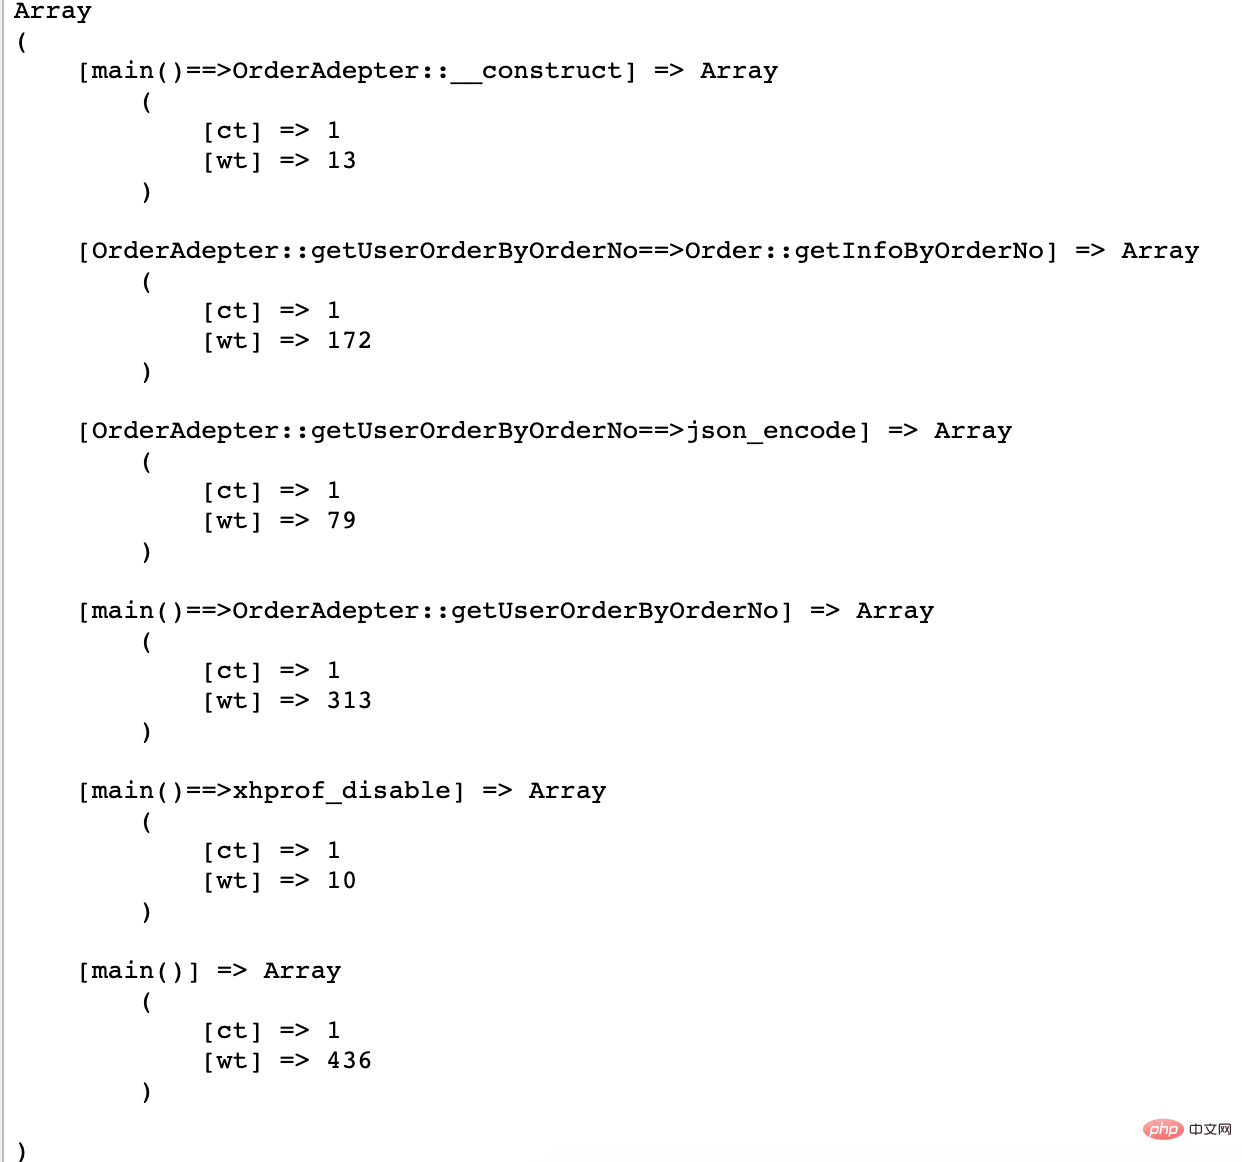
output:

We found that two functions in the xhprof expansion were called. The meaning of the output value
ct represents the current number of calls to this function. In this case, it is all once
wt represents the time consumption of function execution time, the unit is microseconds
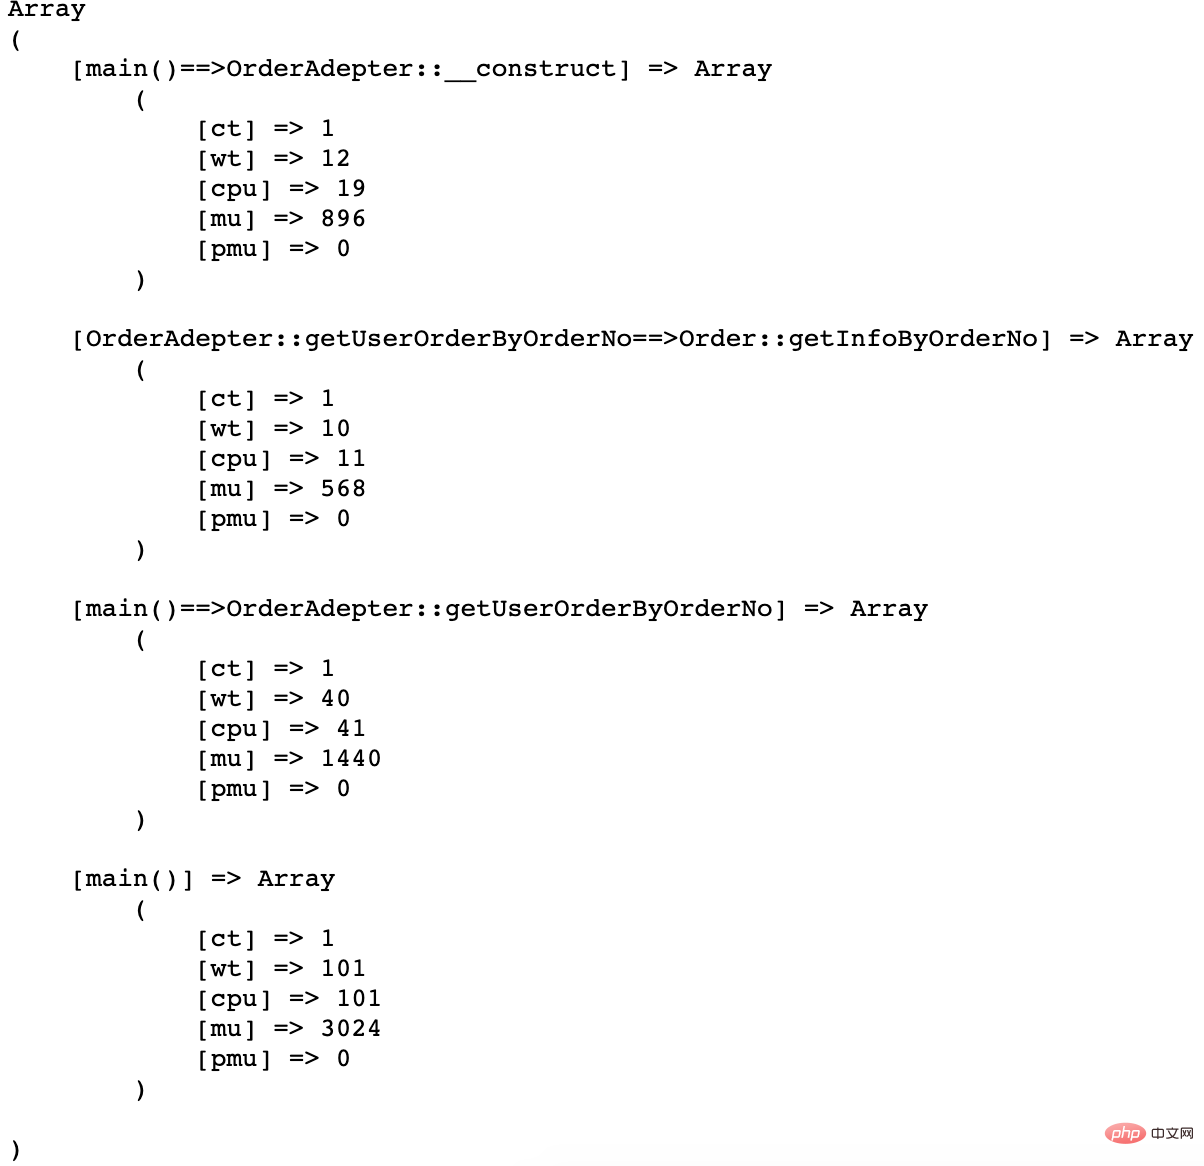
Seeing this, we find that the information we obtain is not very much, for example, we often also care about the occupied memory, cpu and other indicators.
\xhprof_enable(
XHPROF_FLAGS_MEMORY
+XHPROF_FLAGS_CPU
+XHPROF_FLAGS_NO_BUILTINS
);
output:

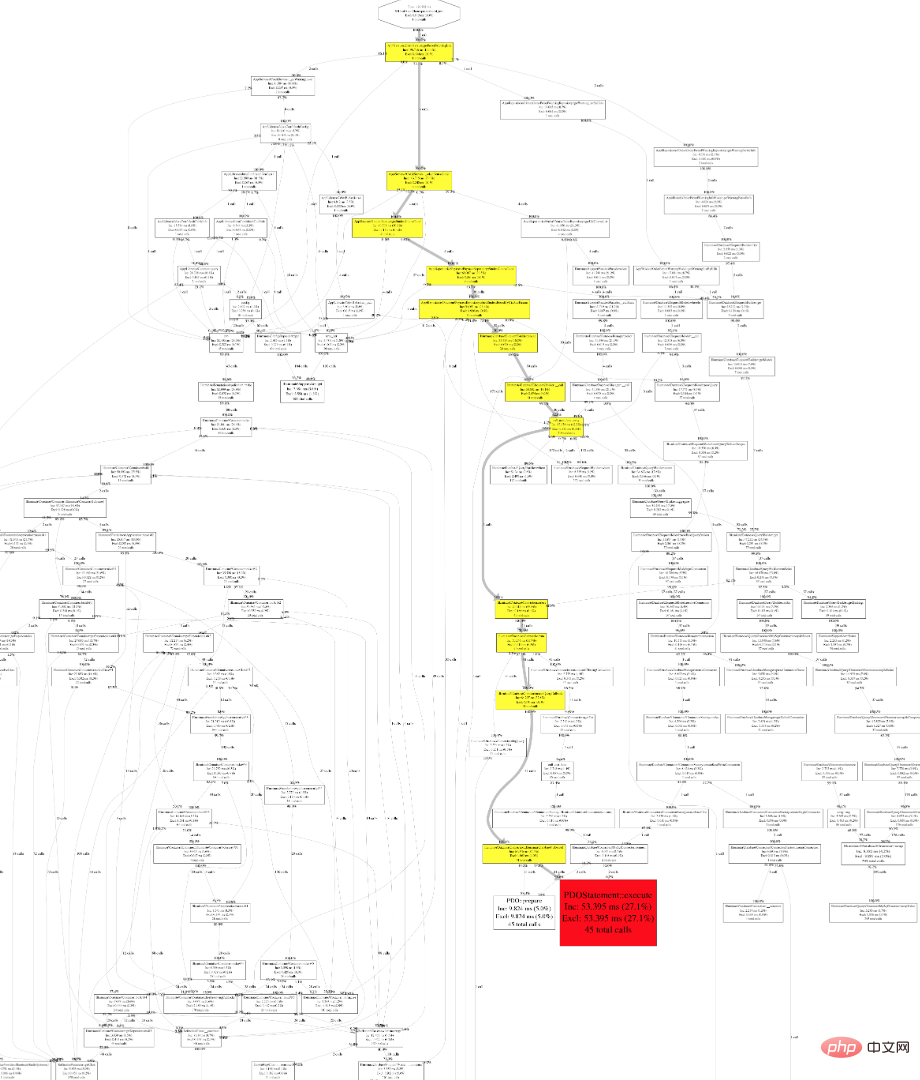
Of course, we still hope that the performance bottleneck can be observed more intuitively in the form of a chart. Let’s see how to use it.3.1 At this time, we need to use the xhprof_lib library
\xhprof_enable(XHPROF_FLAGS_MEMORY + XHPROF_FLAGS_CPU+XHPROF_FLAGS_NO_BUILTINS);

......
$order = new OrderAdepter();
$result = $order->getUserOrderByOrderNo(123);
......

$xhprof_data = \xhprof_disable();

include_once '/data/xhprof-master/xhprof_lib/utils/xhprof_lib.php';
include_once '/data/xhprof-master/xhprof_lib/utils/xhprof_runs.php';
$xhprof_runs = new \XHProfRuns_Default();
$run_id = $xhprof_runs->save_run($xhprof_data, 'your_project');
echo $run_id; //output 5cbf25e21fe9b
. The execution printed out a string, which we can understand as a file identifier. We found that the save_run method was executed, so where was it saved?
Do you remember another configuration when we introduced the xhprof.so extension?
Yes, under the path configured by xhprof.output_dir (you need to manually create the directory yourself)
If you are interested, you can open it and take a look. It contains some serialized object information we analyzed.
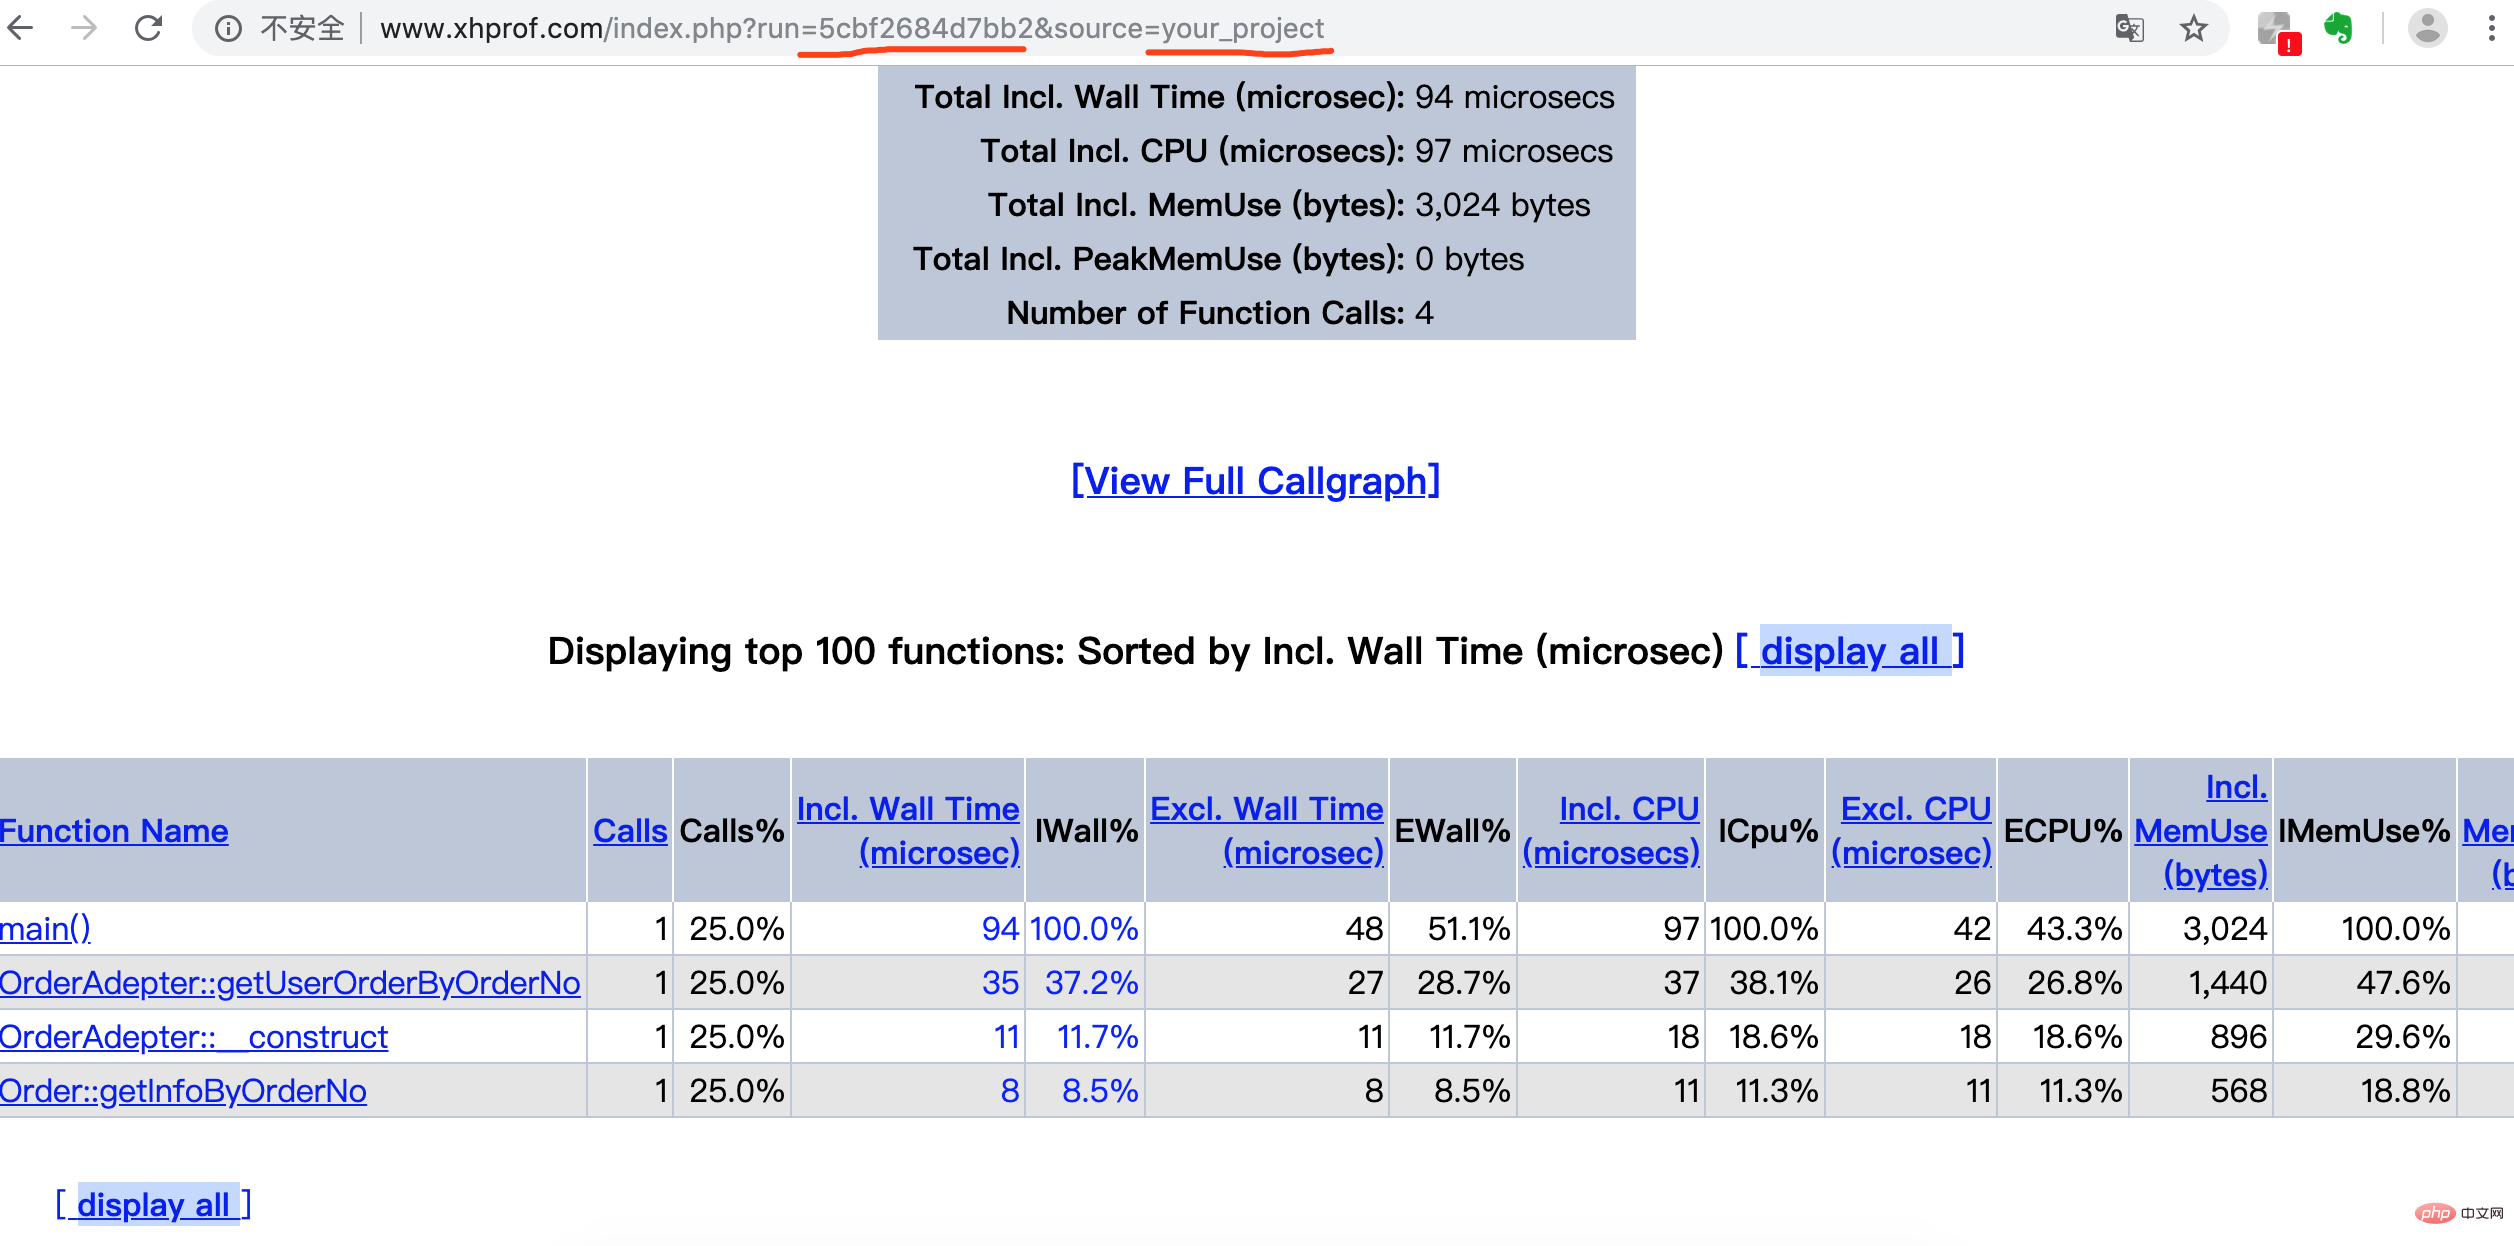
 3.2 Configure a separate service to access Our analysis results
We point to the xhprof_html directory in our xhprof project


The remaining % endings are the corresponding proportions3.3 [View Full Callgraph]You can also execute the following two lines of code to install
yum install -y libpng
yum install -y graphviz
Copy after loginIf you want to view the call process, you need to install the graphviz graphics library. Here we recommend manually installing graphviz 2.24 .0 This version (personally step on the pit, 2.40 is not supported)
yum -y install libtool-ltdl-devel

cd /data/graphviz-2.24.0

./configure
make
make install
Copy after login
Focus on the red and yellow parts, if you feel that only If you want to analyze a certain process, you can click into a method and then click [View Full Callgraph] to view the chart

include_once '/data/xhprof-master/xhprof_lib/utils/xhprof_lib.php';
include_once '/data/xhprof-master/xhprof_lib/utils/xhprof_runs.php';
Copy after loginHere we can use the composer package reference to achieve the same function, and it is recommended to introduce the pbweb/xhprof package.
Recommended learning:php video tutorial
The above is the detailed content of How to use xhprof analysis in php7. For more information, please follow other related articles on the PHP Chinese website!
 What is the difference between php5 and php7
 What is the difference between php7 and php8
 What private information will Douyin's close friends see?
 What to do if the documents folder pops up when the computer is turned on
 How to delete WeChat emoticons
 Can the appdata folder be deleted?
 How to use count function
 OKEX official website