The following tutorial column ofPagoda Installationwill introduce to you how to use the Pagoda panel to view and analyze website logs and regularly segment website logs. I hope it will be helpful to friends in need!

VPS Primary school students wanted to change a wave of friend links on a whim a few days ago. As a result, I looked at the data of the free VPS sharing blog and found that it was very unsatisfactory. The reason was except for the occasional In addition to the silent care from colleagues, the VPS primary school students also wanted to see if there were any other problems with the website, so they planned to read the website logs. I also learned some knowledge during this process, which I would like to share with you.
View the website log of Pagoda panel

View the website log of Pagoda panel
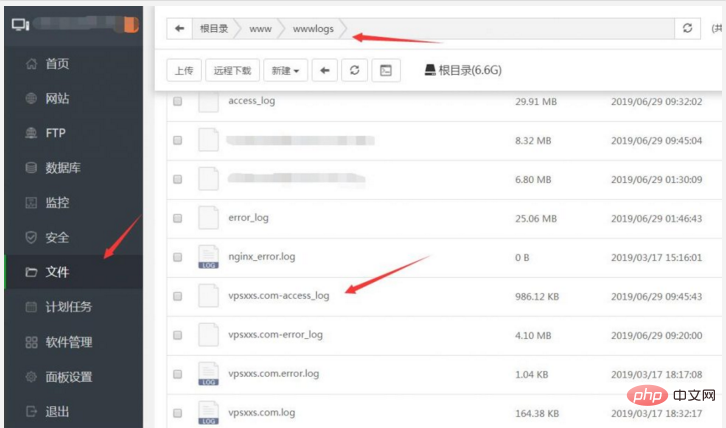
Use To view website logs in the Pagoda Panel, select "File" on the left side of the home page of the Pagoda Panel, and then select the wwwlogs folder under the www folder in the breadcrumb navigation. You can see the website logs here. The website domain name-access_log is the log file. After downloading the file, just change _log to .log.
It should be noted that, like most visual panels, website logs are 1G in size by default, so friends who use other panels such as AMH or WDCP sometimes find that the disk space is much less because of automatic generation There are too many 1G log files. When VPS primary school students view the log file for the first time, the log file is also 1G. It is very troublesome to download and analyze. Fortunately, the Pagoda panel has the function of automatically dividing website logs.
Pagoda panel regularly splits website log

Pagoda panel log cutting
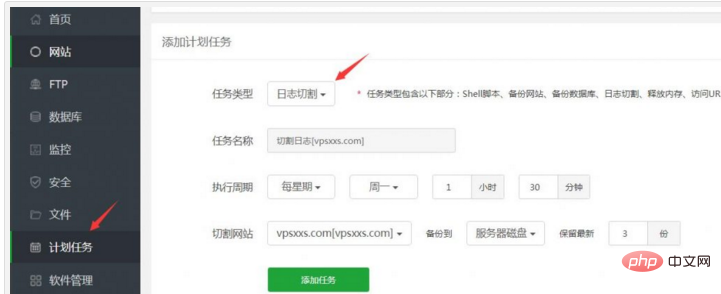
at Select "Scheduled Tasks" on the left side of the backend homepage of the Pagoda Panel. Select Log Cutting here as the task type. You can select the execution cycle and the number of backup copies. For general websites, the default once a week is enough. If the website traffic is relatively large, the execution cycle can be selected every day. After selecting, click "Add Task" to the set time point, and the Pagoda Panel will automatically cut the log. This will avoid the problem of the website log file being too large and the website log file taking up disk space.
View and analyze website logs
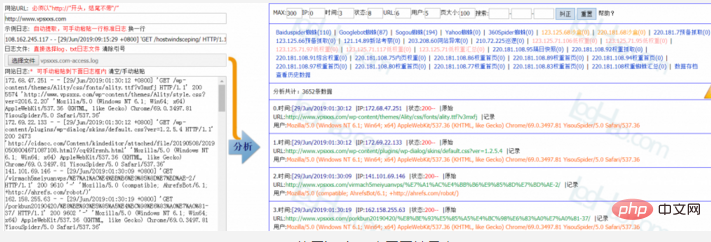
Although website log files can be opened with Notepad, generally you still use auxiliary tools to view website logs, VPS primary school students I prefer to use the online website log viewing tool loghao

Use loghao to view website logs
loghao is popular mainly because it can be used by opening a web page, which is more convenient. Other website log viewing tools that are more commonly used are "Lightyear Log Analysis Tool" and "Love Station Toolkit". They are all free, and their functions are not much different. You can just choose what you are used to.
The above is the detailed content of Teach you how to use the Pagoda panel to view and analyze website logs and regularly segment website logs. For more information, please follow other related articles on the PHP Chinese website!


