
❝It is inevitable that you will encounter unknown errors during the development process. Please specify not to debug bit by bit! This article will show you how to use atom to debug the program. If you have any If you have any questions, just reply in the comment area.
❞
Click file->settings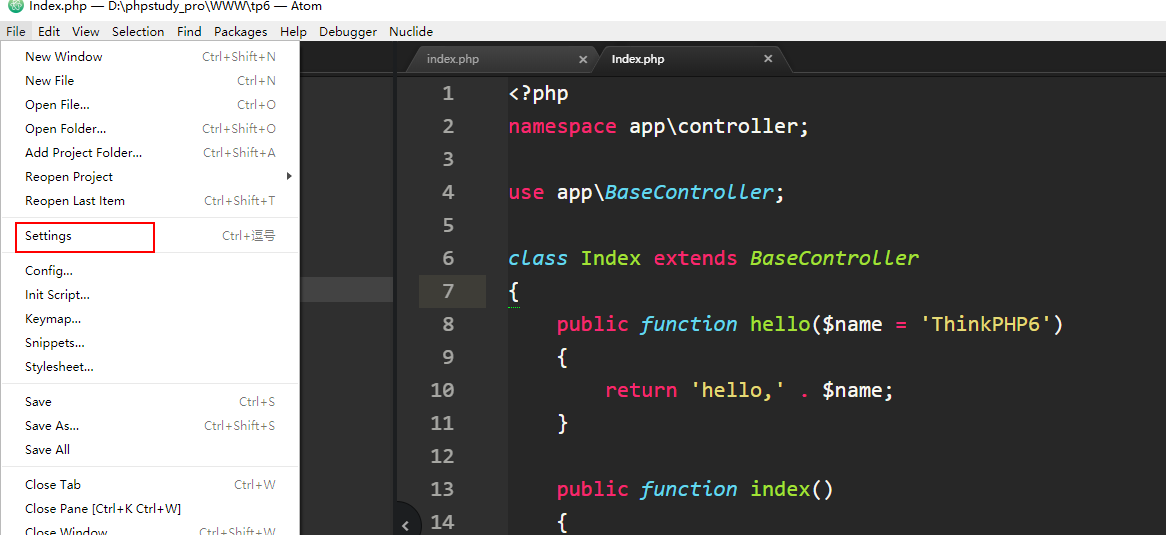 Then click install and search for php-debug. If the search here cannot come up, you need to find a way! We must learn to surf the Internet scientifically!
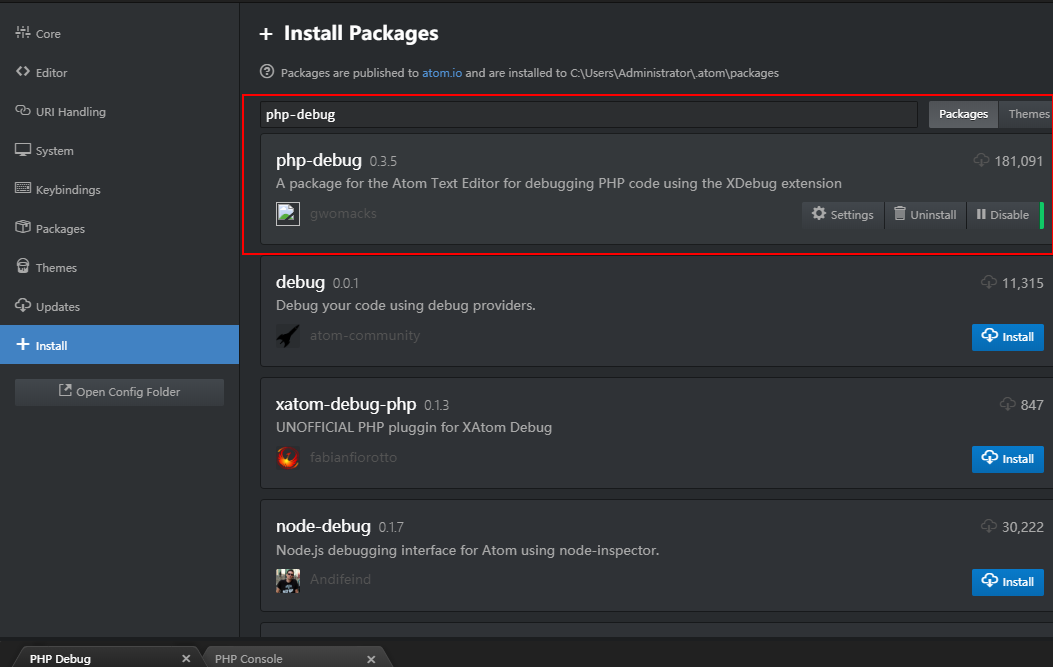 Successful installation is like this
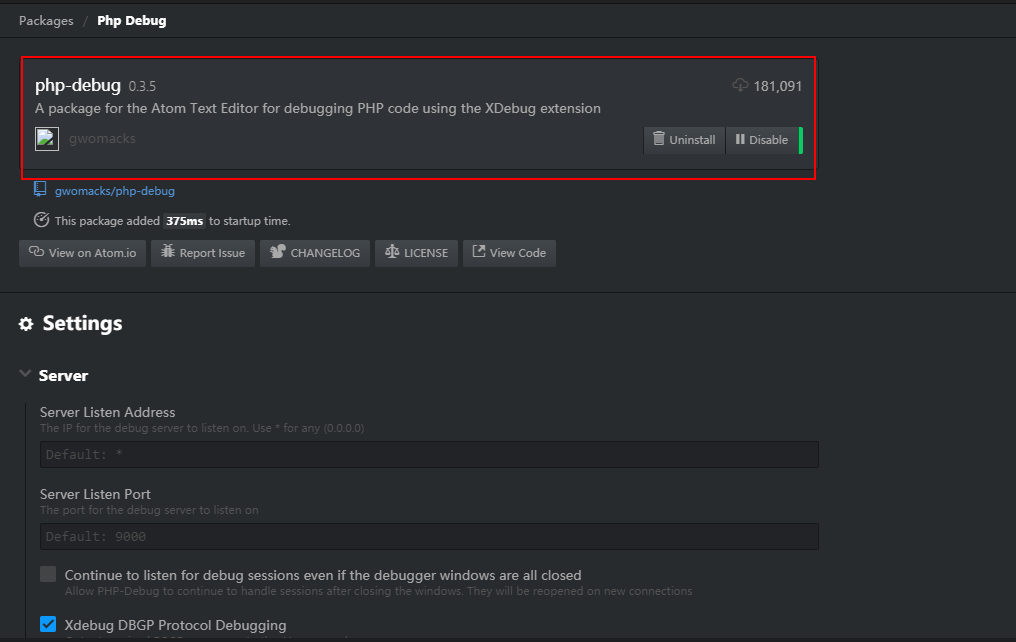
Download address:https://xdebug.org/download, After opening the address, you can see the extension. The one installed here is php7.3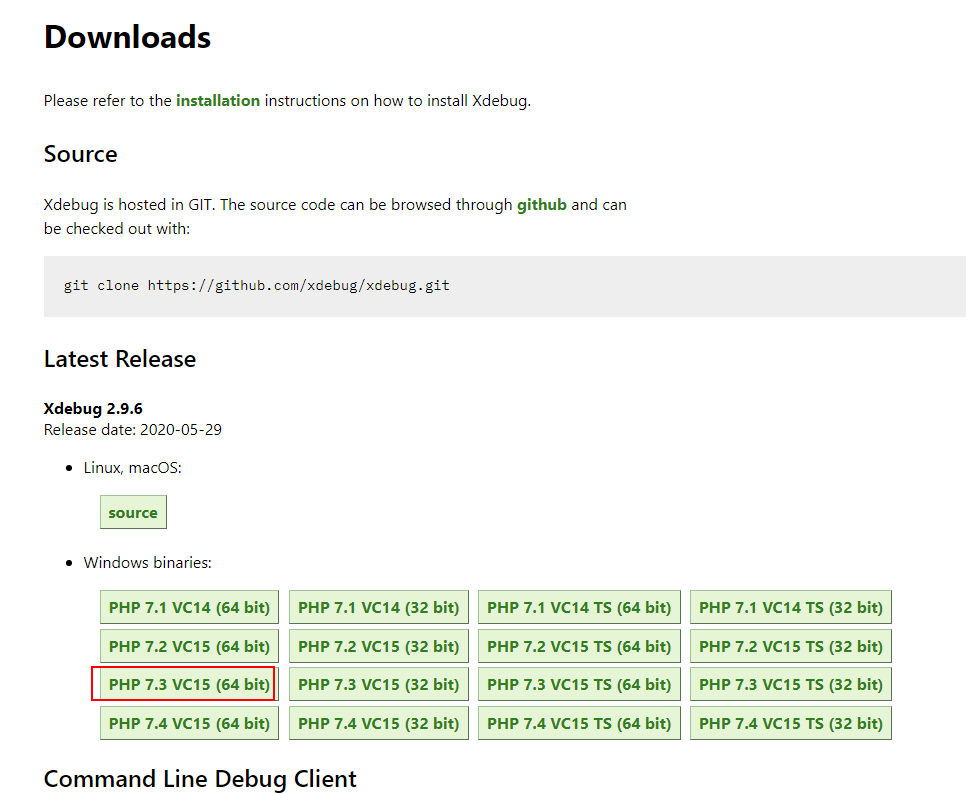 , but there are two php7.3s, which one should you choose? Open your PHP environment and you can see vc15
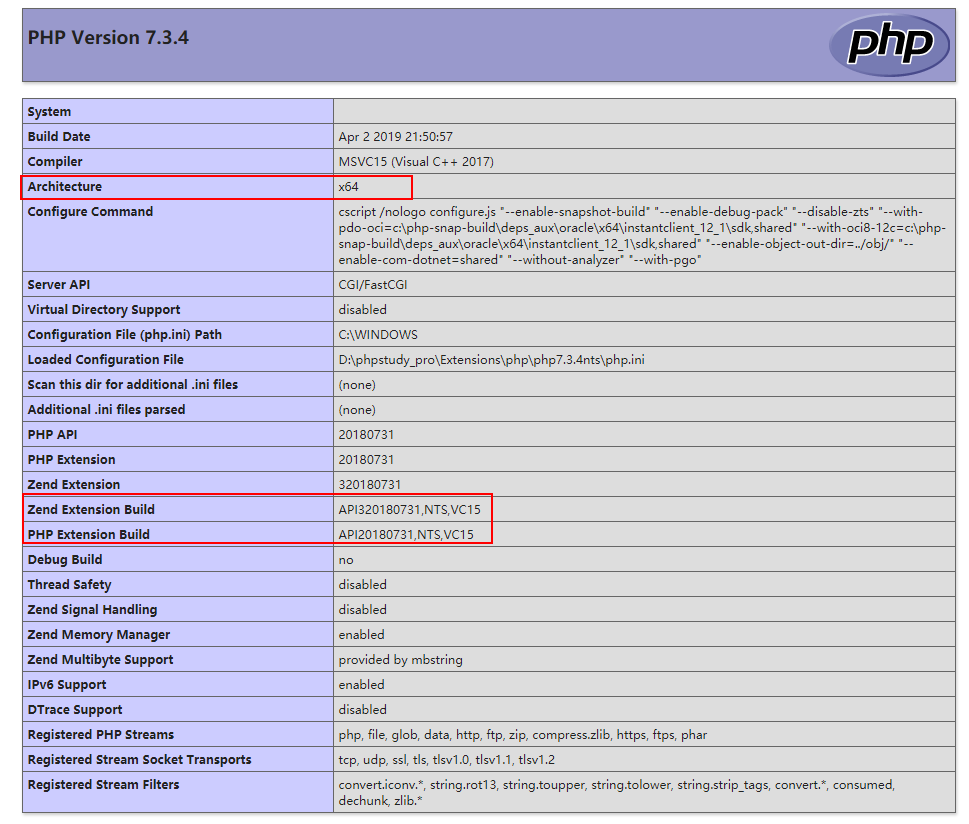 in the box, then put the downloaded file into
D:\phpstudy_pro\Extensions\php\php7.3.4nts\ext, here is the address of Kaka . Just put it in your own PHP environment.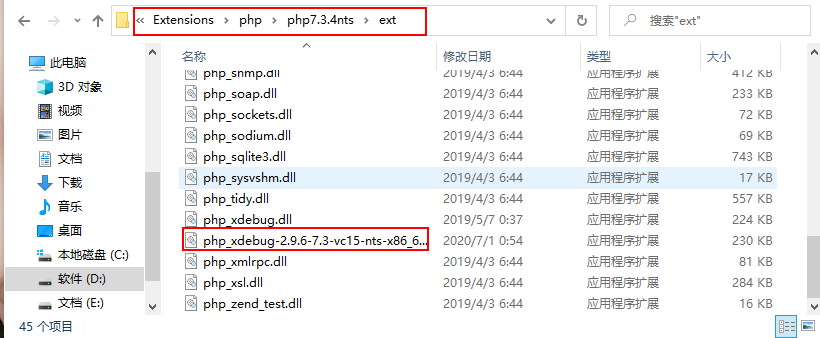
Then find your php.ini file and copy the following configuration Go in. Remember to modify the location ofzend_extension.
This location is related to your PHP location.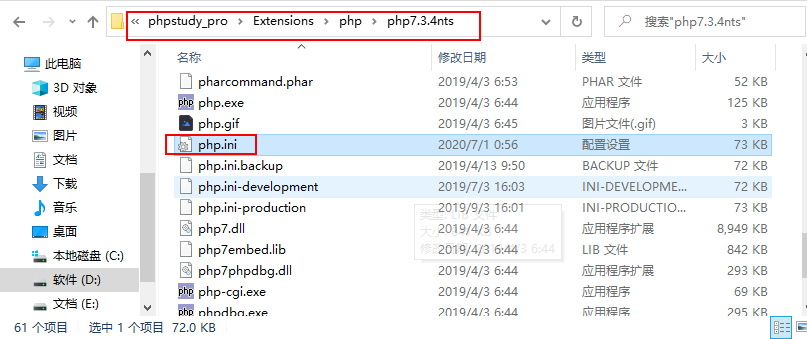
[Xdebug]
zend_extension = D:\phpstudy_pro\Extensions\php\php7.3.4nts\ext\php_xdebug-2.9.6-7.3-vc15-nts-x86_64.dll
xdebug.remote_enable = On
xdebug.remote_host = localhost
xdebug.remote_port = 9000
xdebug.remote_handler = dbgp
xdebug.idekey=xdebug-atom
How to determine this location! If you are using the new version ofphpstudy,D:\phpstudy_pro\Extensions\php\php7.3.4nts\extThat is this location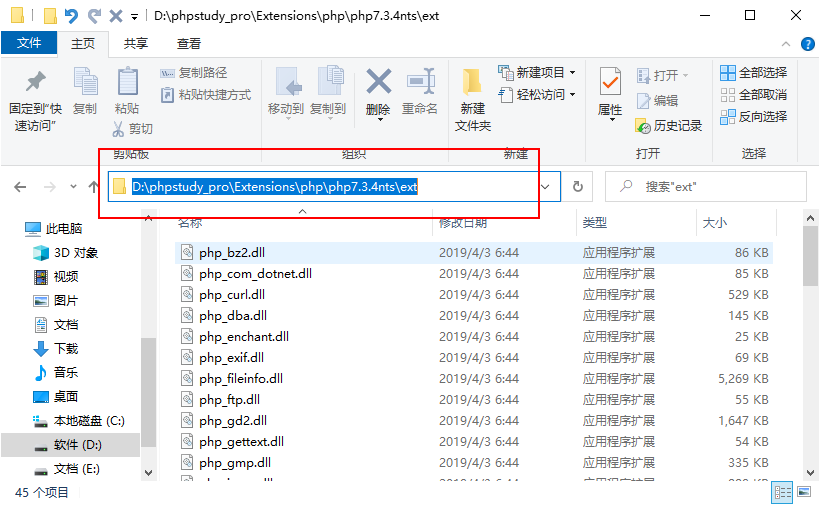 If you are using the old version of phpstudy The location is
C:\phpStudy\PHPTutorial\php\php-7.1.13-nts\ext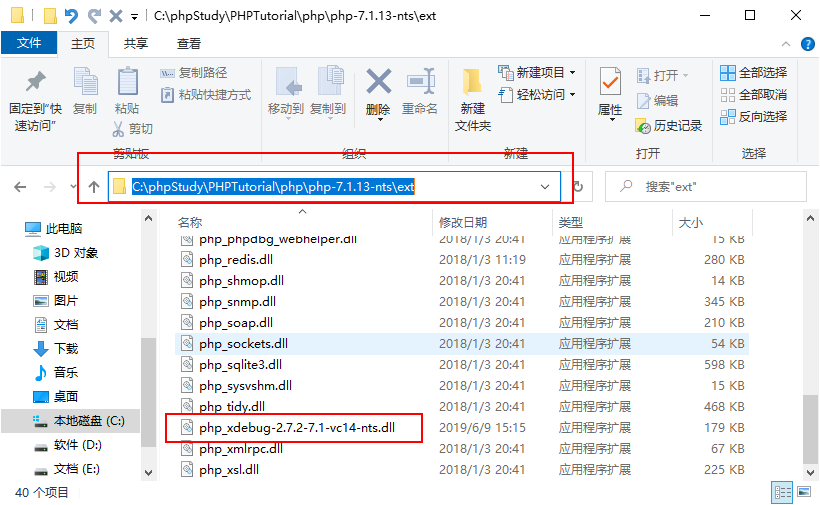
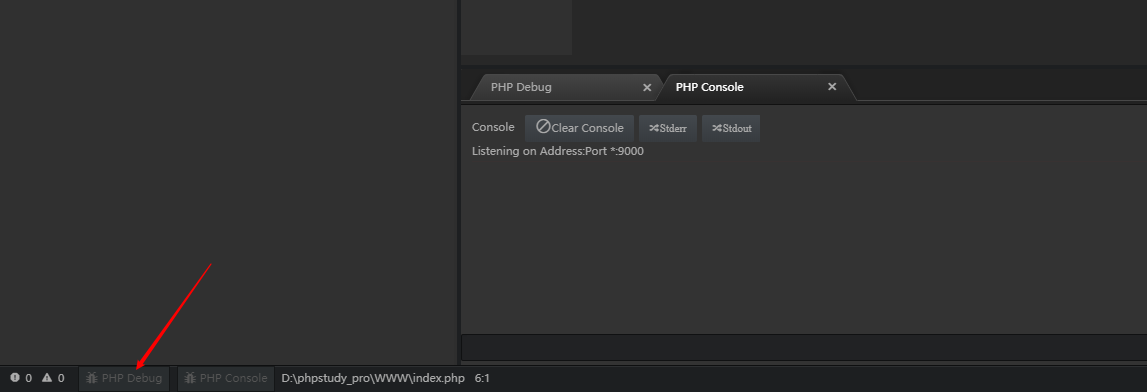
http://localhost/index.php?XDEBUG_SESSION_START=1Note here the following parameters.
The debugging panel will come out at this time, and you can see that our variable values have been printed.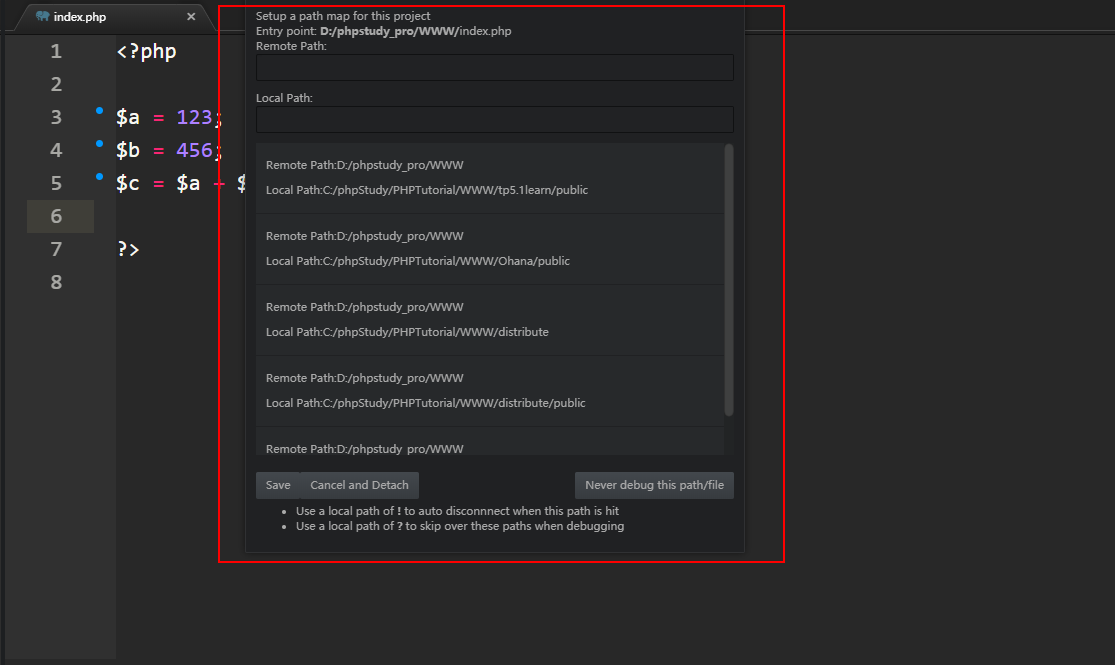 Up to this point our breakpoint debugging is complete.
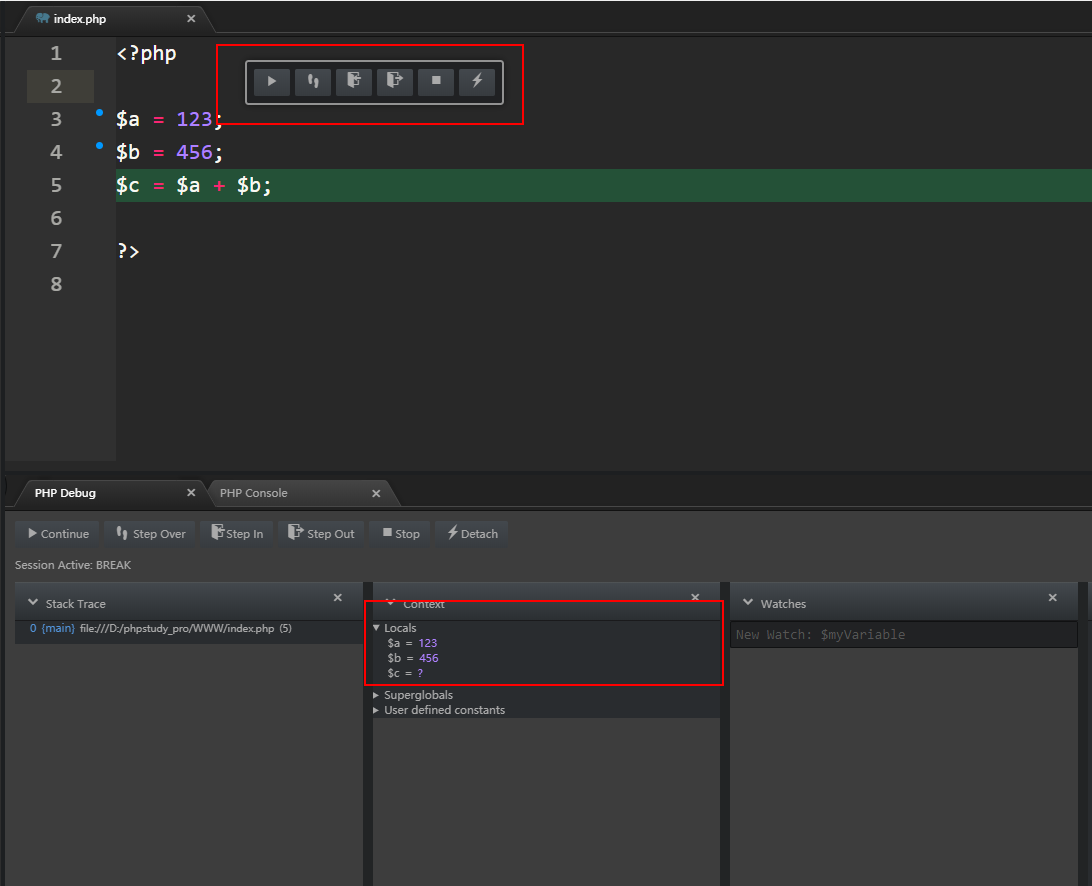
Summary of important steps for configuring breakpoints.
?
The above is the detailed content of An article to help you learn breakpoint debugging. For more information, please follow other related articles on the PHP Chinese website!