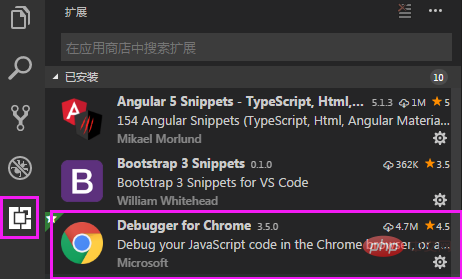
First install the extended debugging plug-indebugger for chrome

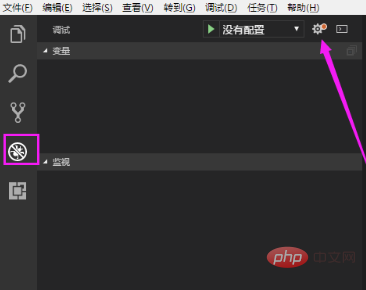
Click the ladybug button to debug the project Configuration, click the configuration button

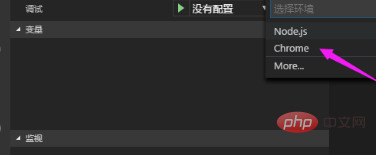
Select the Chrome environment

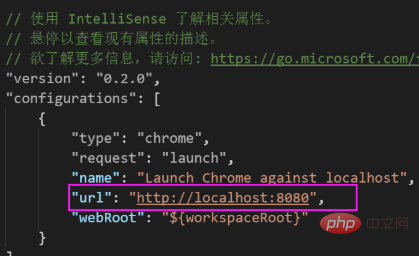
##The Chrome debugging configuration file launch.json will pop up, modify it The port can be

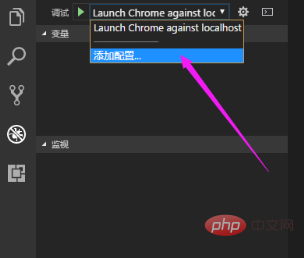
#If there is no lauch.json configuration file generated, you can also open the configuration file in the following way. Select Add Configuration

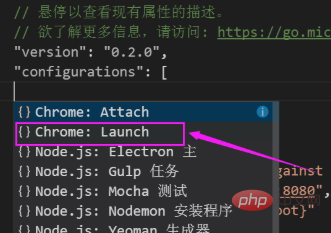
Then select Chrome: Launch and modify the port

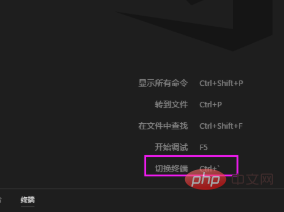
Open the project and use ctrl ` [Note that the ` is on the Tab key] Enter ng serve to start the project

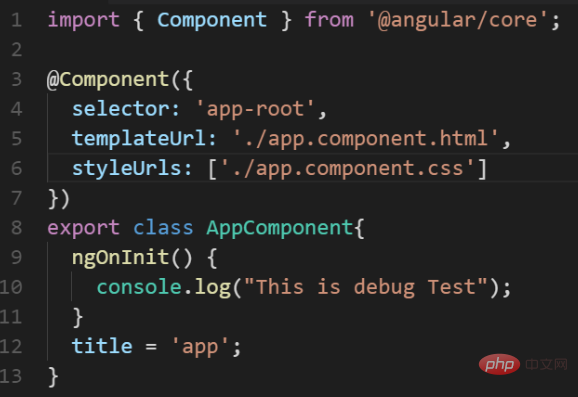
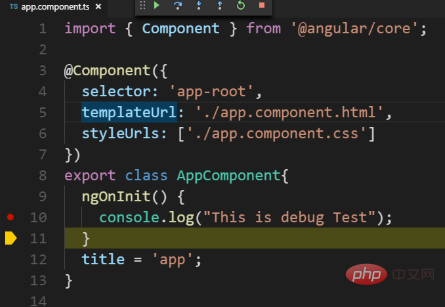
to switch to the ladybug interface. For example, we set a break in app.component.ts Click

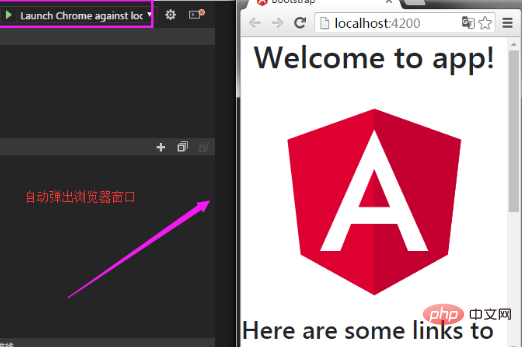
to start the debugging button, and the browser page will automatically pop up

After refreshing the page, you will find that the program is running At the breakpoint location

# we can view variables, capture exceptions, call stacks and other debugging.
Recommended related articles and tutorials:
vscode tutorial
The above is the detailed content of How to debug code with vscode. For more information, please follow other related articles on the PHP Chinese website!

