Home > Development Tools > VSCode > How to debug node in vscode

How to debug node in vscode

爱喝马黛茶的安东尼
Release: 2019-12-06 17:11:27
Original
3670 people have browsed it

How to debug node in vscode

#1. Create a configuration file

1. Select your project

How to debug node in vscode

2. Select the language of your project

How to debug node in vscode

3. Generate .vscode/launch.json under the current project path

{
    // Use IntelliSense to learn about possible attributes.
    // Hover to view descriptions of existing attributes.
    // For more information, visit: https://go.microsoft.com/fwlink/?linkid=830387
    "version": "0.2.0",
    "configurations": [
        {
            "type": "node",
            "request": "launch",
            "name": "Launch Program",
            "program": "${workspaceFolder}/test.js"
        }
    ]
}
Copy after login

type - The debugger type used for this launch configuration. Each installed debugging extension introduces a type, for example, the node built-in node debugger, php and the goPHP and Go extensions.

request - The request type for this launch configuration. Currently supported are launch and attach. (See Chapter 3 below for a detailed explanation of request)

name - Friendly name, displayed in the "Debug Launch Configuration" drop-down list.

program - The executable or file to run when the debugger is started.

args - Arguments passed to the program for debugging.

env - environment variable (the value null can be used to "undefine" the variable).

cwd - The current working directory, used to find dependencies and other files.

Note 1: ${workspaceFolder} represents the root path of the workspace folder, ${file} represents the file opened in the active editor.

Note 2: "program": "${workspaceFolder}/test.js", I'm not sure how vscode recognizes /test.js in the current directory I want to debug. [To be solved]

Note 3: You can also write the configuration file into User Settings to become a global configuration.

How to debug node in vscode

4. Quickly return to your configuration file

How to debug node in vscode

2. Breakpoint

1. Breakpoint (traditional breakpoint)

(1) The graphics are replaced by circles;

(2) cannot be typed on a blank line.

How to debug node in vscode

2. Logpoint

(1) You can print out information in the debug console (wrap expressions with {});

(2) The graphics are replaced by diamonds;

(3) If it is not placed on the statement, but on a blank line, it will disappear during debugging and execution, but the effect will not be affected. So it is still recommended to type in the sentence!

How to debug node in vscode

3. Conditional Breakpoint

is divided into two conditions: expression/number of hits

(1) You can break to the statement closest to the breakpoint when the conditions are met;

(2) The graphic is replaced by a square;

(3) If you do not hit the statement, but A blank line will disappear during debugging, but will not affect the effect.

3. Debugging

#The launch.json configuration file mentioned in Chapter 1 has a request field, and the value range is: launch and attach

launch: vscode e runs a debugging process independently

attach: You start debugging by yourself through node --inspect-brk xxx.js, and then vscode attaches it

Let’s talk about the difference between specific debugging methods in these two categories:

1. Launch method

(1) Click Launch Program

How to debug node in vscode

(2) Select which configuration file to launch

How to debug node in vscode

Note: The value of the name attribute in the launch.json configuration file will be displayed here drop-down list.

(3) Start debugging

2. Attach method

(1) Turn on Auto Attach: On

How to debug node in vscode

(2)以调试的方式启动 node

node --inspect-brk test.js
Copy after login

(3)开始调试

四、调试相关功能

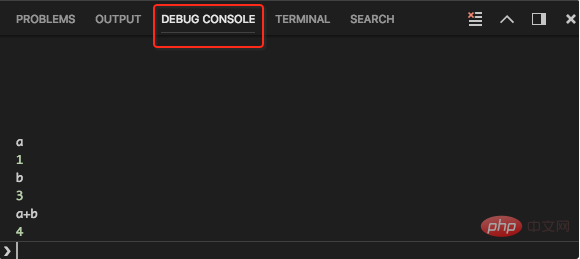
1、DEBUG CONSOLE

可以在此操作变量
How to debug node in vscode

五、多目标调试

需求:同时调试 server.js 和 client.js

1、建立配置文件

{
    "version": "0.2.0",
    "configurations": [
        {
            "type": "node",
            "request": "launch",
            "name": "Server",
            "program": "${workspaceFolder}/server.js",
            "cwd": "${workspaceFolder}"
        },
        {
            "type": "node",
            "request": "launch",
            "name": "Client",
            "program": "${workspaceFolder}/client.js",
            "cwd": "${workspaceFolder}"
        }
    ],
    "compounds": [
        {
            "name": "Server/Client",
            "configurations": ["Server", "Client"]
        }
    ]
}
Copy after login

2、开始调试

注1:调试的时候,可以同时运行程序。

注2:当修改代码,同时运行的程序会立即生效,而调试的代码还是老的。

PHP中文网,有大量免费的vscode入门教程,欢迎大家学习!

The above is the detailed content of How to debug node in vscode. For more information, please follow other related articles on the PHP Chinese website!

Related labels:
source:php.cn
Statement of this Website
The content of this article is voluntarily contributed by netizens, and the copyright belongs to the original author. This site does not assume corresponding legal responsibility. If you find any content suspected of plagiarism or infringement, please contact admin@php.cn
Popular Tutorials
More>
Latest Downloads
More>
Web Effects
Website Source Code
Website Materials
Front End Template