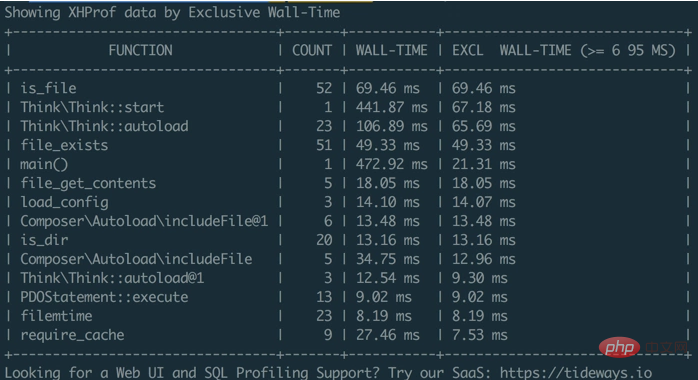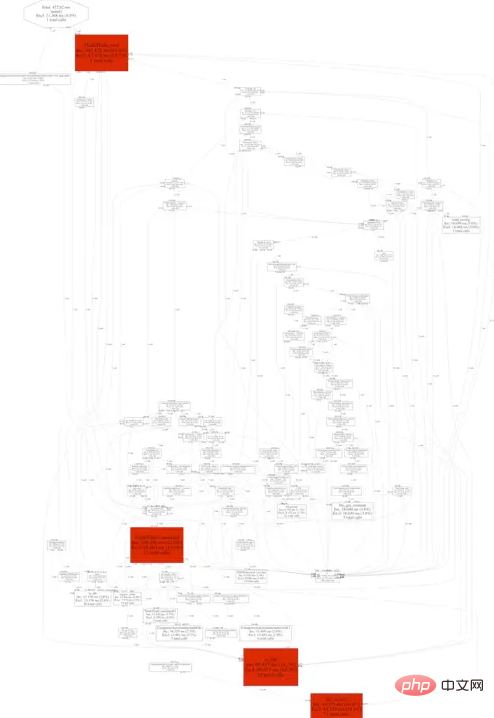
Toolkit is a command line tool for performance analysis officially provided by tideway. If you only develop and debug interface performance locally and do not want to install xhgui, then using toolkit is enough.
Install
Install tideways extension
git clone https://github.com/tideways/php-xhprof-extension.git
cd php-profiler-extension
phpize
./configure
make && make install
Add to php.ini
extension=tideways_xhprof.so
Restart php-fpm
service php-fpm restart
toolkit installation
go get github.com/tideways/toolkit
# 安装graphviz
# macOS
brew install graphviz
# ubuntu
sudo apt-get install -y graphviz
Set alias
alias tk=toolkit
tideways toolkit
Code Buried Point
Add
if (extension_loaded('tideways_xhprof')) {
    tideways_xhprof_enable(TIDEWAYS_XHPROF_FLAGS_CPU | TIDEWAYS_XHPROF_FLAGS_MEMORY);
}
// 你的代码
application();
if (extension_loaded('tideways_xhprof')) {
    $data = tideways_xhprof_disable();
    file_put_contents(
        sprintf('%s/app.xhprof', '/path/to'),
        json_encode($data)
    );
}to the program entrance to execute the code , and then /path/to/app.xphrof
Performance Analysis
tk analyze-xhprof /path/to/app.xphrof

The default performance analysis indicator is wt_excl , other indicators include
1.wt call duration, including sub-functions
2.excl_wt call duration, excluding sub-functions
3.cpu CPU call duration, including Subfunction
4.excl_cpu CPU call duration, excluding subfunction
5.memory memory consumption (bytes), including subfunction
6.excl_memory memory consumption ( Bytes), excluding sub-functions
7.io io duration, including sub-functions
8.excl_io io duration, excluding sub-functions
Generation performance The indicators displayed in the bottleneck chart
tk generate-xhprof-graphviz /path/to/app.xhprof
dot -Tpng callgraph.dot > callgraph.png

#1.Function name
2.Inc Function running time, including sub-functions
3.Excl Function running time, excluding sub-functions
4.total calls Total calls
The above is the detailed content of tideways+toolkit performs performance analysis on php code. For more information, please follow other related articles on the PHP Chinese website!