


Analysis of JVM memory area and garbage collection (picture and text)

The content of this article is about the analysis of JVM memory area and garbage collection (pictures and texts). It has certain reference value. Friends in need can refer to it. I hope it will be helpful to you.
1. Introduction to JVM
JVM, the full name is Java Virtual Machine, which is Java virtual machine. Applications written in Java as a programming language run on the JVM. JVM is a specification for computing devices. It is a fictional computer that is implemented by simulating various computer functions on an actual computer. A very important feature of Java is its independence from the platform, and the JVM is the key to realizing this feature.
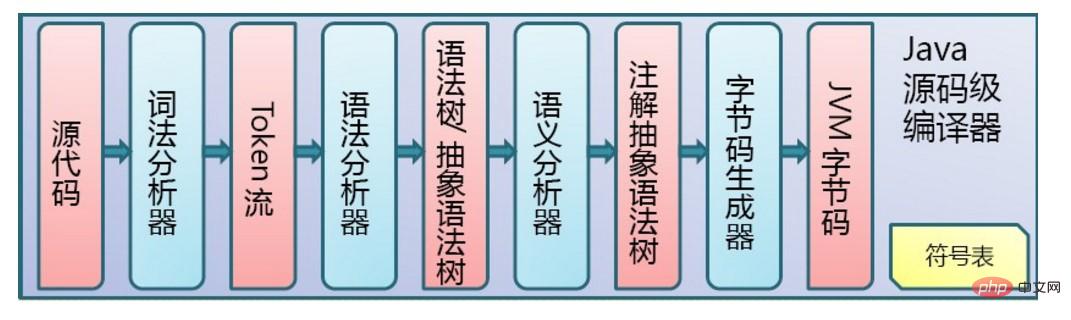
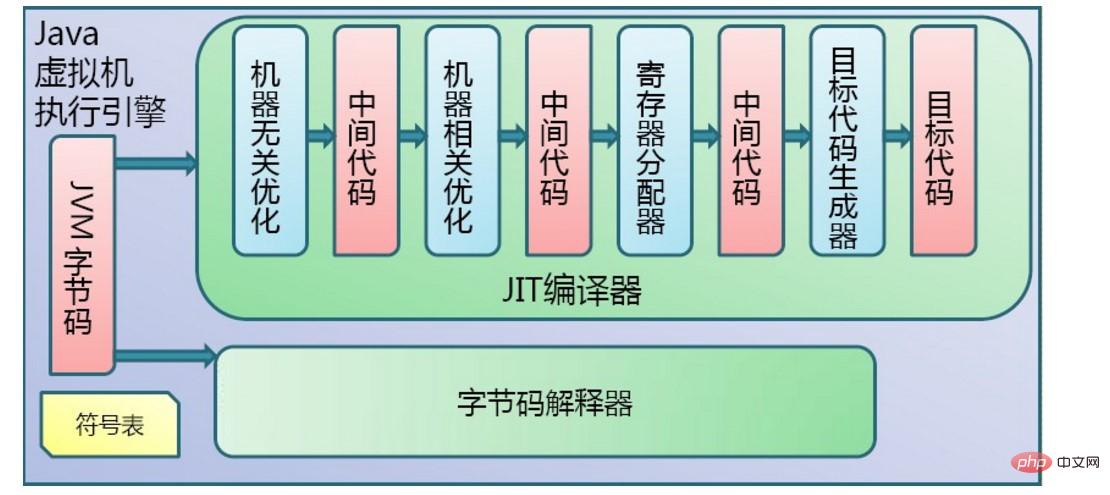
The execution of the program by the JVM is mainly divided into two steps. The first step is compilation, that is, the .java source file is compiled into a .class bytecode file. The second step is interpretation. The JVM interprets the bytes code file for interpretation and execution. The two step flow charts are shown in the following two figures respectively:
2. JVM memory area
The entire JVM system is divided into two subsystems. The first one is ClassLoader, which is the class loader. Its function is to load the written class into the JVM. The second is the Execution Engine, which is the execution engine, responsible for interpreting and executing the compiled bytecode files. The Execution Engine mentioned above is divided into two parts. The first part is the Runtime data area, which is the runtime data area, which is equivalent to the memory in the JVM. The second part is the Native interface, which is the localization interface, which is mainly used to execute other non-Java programs. A program written in a programming language.
The key point is the former Runtime data area, which is divided into five parts, namely Method area (method area), Heap (heap), VM stack (virtual machine stack), Program counter register (program counter), Native method stack. The first two threads are shared, and the latter three threads are isolated. As shown in the figure below:
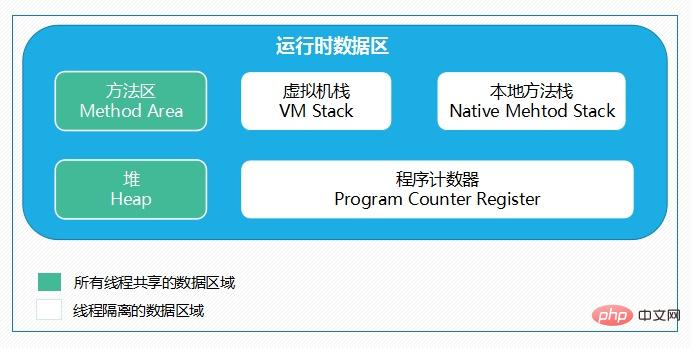
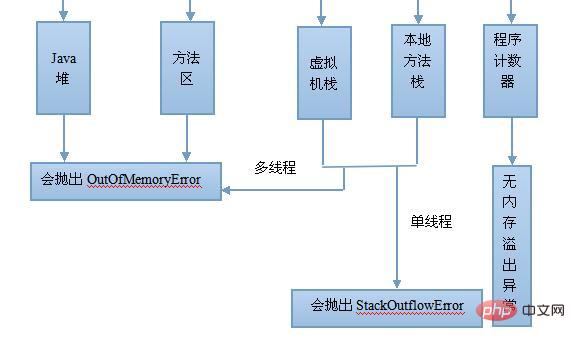
In summary, the JVM will allocate the Method area (method area) and Heap (heap) when it is initially run. Every time the JVM encounters a thread, it allocates Program counter (program counter), VM stack (virtual machine stack), and Native method stack (local method stack). When the thread terminates, the three (virtual machine stack, local method stack) The memory space occupied by the method stack and program counter) will also be released. This is also the reason why the data area is divided into thread sharing and thread isolation. The life cycle of the three thread isolated areas is the same as that of the thread to which it belongs, and the thread shared area is the same as the life cycle of the Java program running, so this is also system garbage. The reason why recycling occurs only in the thread-shared area (actually, for most virtual machines, it occurs on the Heap). Regarding the memory overflow exception, the following figure shows:
1. Method area
The method area includes constant pool and static fields. Stores the information of the loaded class (name, modifiers, etc.), static variables of the class, constants of the class, Field information of the class, and method information of the class. When developers obtain information in the program through methods such as getName and isInterface in the Class object, these data come from the method area.
2. Heap (Heap)
The heap is the largest piece of memory managed by the JVM. Almost all object instances and arrays are in this area. It can be considered that all objects created by new in Java are The memory of objects is allocated here, and the memory of objects in the heap needs to wait for GC to be recycled.
3. Program counter register (program counter)
The program counter is a small memory space. It is the line number indicator of the bytecode executed by the current thread. The bytecode When the interpreter is working, it selects the next bytecode instruction to be executed by changing the value of the counter. Basic functions such as branches, jumps, and loops all rely on it to implement.
4. VM stack (Virtual Machine Stack)
The virtual machine stack describes the memory model of Java method execution. Each method will create a stack frame (Stack Frame) when executed. The stack frame is used to store local variable tables (basic data types, object references, etc.), operand stacks, dynamic links, method return addresses and some additional additional information.
5. Native method stack
This area plays a very similar role to the virtual machine stack, except that the virtual machine stack serves the virtual machine to execute Java methods, and the local method The stack serves the native operating system (Native) methods used.
3. JVM garbage collection
The GenerationalCollecting (garbage collection) principle of JVM is to divide objects into young generation (Young), old generation (Tenured), and persistent generation (Perm), and use different algorithms for objects with different life cycles.
Usually JVM memory recycling always refers to Heap (heap) memory recycling. Indeed, only the content in the Heap (heap) is dynamically allocated, so the young generation and old generation of the above objects both refer to the JVM. Heap (heap) space, and the persistent generation is the Method area (method area) mentioned before, which does not belong to the Heap (heap).
1. Young Generation
When a Java application allocates Java objects, these objects will be allocated to the young generation heap space
This space is mostly small objects and will be recycled frequently
Since the garbage collection of the young generation heap space will be very frequent, its garbage collection algorithm will pay more attention to recycling efficiency
2 . Old generation
The long-lived objects in the young generation heap space will be transferred (perhaps permanently) to the old generation heap space
This heap space is usually larger than The heap space of the young generation is large, and its space growth rate is slow
Since most of the JVM heap space is allocated to the old generation, its garbage collection algorithm needs to be more space-saving, and this algorithm needs to be able to handle low Garbage-density heap space
3. The persistent generation
stores the metadata of VM and Java classes, as well as the static of interned strings and classes Variable
When the heap space of these three generations is tight or there is not enough space to allocate for new requests, the garbage collection mechanism will take effect. There are two types of garbage collection: Minor GC and Full GC. When the young generation heap space is full, a collection will be triggered to move surviving objects to the old generation heap space. When the old generation heap space is full, a full collection covering the entire range of the object heap will be triggered.
This is a brief analysis of JVM memory area and garbage collection, for reference only.
The above is the detailed content of Analysis of JVM memory area and garbage collection (picture and text). For more information, please follow other related articles on the PHP Chinese website!

Hot AI Tools

Undress AI Tool
Undress images for free

Undresser.AI Undress
AI-powered app for creating realistic nude photos

AI Clothes Remover
Online AI tool for removing clothes from photos.

Clothoff.io
AI clothes remover

Video Face Swap
Swap faces in any video effortlessly with our completely free AI face swap tool!

Hot Article
Hot Tools

Notepad++7.3.1
Easy-to-use and free code editor

SublimeText3 Chinese version
Chinese version, very easy to use

Zend Studio 13.0.1
Powerful PHP integrated development environment

Dreamweaver CS6
Visual web development tools

SublimeText3 Mac version
God-level code editing software (SublimeText3)


 JVM memory management key points and precautions
Feb 20, 2024 am 10:26 AM
JVM memory management key points and precautions
Feb 20, 2024 am 10:26 AM
Key points and precautions for mastering JVM memory usage JVM (JavaVirtualMachine) is the environment in which Java applications run, and the most important one is the memory management of the JVM. Properly managing JVM memory can not only improve application performance, but also avoid problems such as memory leaks and memory overflows. This article will introduce the key points and considerations of JVM memory usage and provide some specific code examples. JVM memory partitions JVM memory is mainly divided into the following areas: Heap (He
 A distributed JVM monitoring tool, very practical!
Aug 15, 2023 pm 05:15 PM
A distributed JVM monitoring tool, very practical!
Aug 15, 2023 pm 05:15 PM
This project is designed to facilitate developers to monitor multiple remote host JVMs faster. If your project is Spring boot, it is very easy to integrate. Just introduce the jar package. If it is not Spring boot, don’t be discouraged. You can quickly initialize a Spring boot program and introduce it yourself. Jar package is enough
 Detailed explanation of JVM command line parameters: the secret weapon to control JVM operation
May 09, 2024 pm 01:33 PM
Detailed explanation of JVM command line parameters: the secret weapon to control JVM operation
May 09, 2024 pm 01:33 PM
JVM command line parameters allow you to adjust JVM behavior at a fine-grained level. The common parameters include: Set the Java heap size (-Xms, -Xmx) Set the new generation size (-Xmn) Enable the parallel garbage collector (-XX:+UseParallelGC) Reduce the memory usage of the Survivor area (-XX:-ReduceSurvivorSetInMemory) Eliminate redundancy Eliminate garbage collection (-XX:-EliminateRedundantGCs) Print garbage collection information (-XX:+PrintGC) Use the G1 garbage collector (-XX:-UseG1GC) Set the maximum garbage collection pause time (-XX:MaxGCPau
 What is the function of jvm virtual machine
Jan 10, 2024 pm 02:47 PM
What is the function of jvm virtual machine
Jan 10, 2024 pm 02:47 PM
The functions of the jvm virtual machine: 1. Platform independence; 2. Memory management; 3. Automatic garbage collection; 4. Security mechanism; 5. Multi-thread support; 6. Runtime checking; 7. Object-oriented features; 8. Performance optimization . Detailed introduction: 1. Platform independence, JVM enables Java programs to run on different operating systems and hardware platforms, greatly improving the portability and cross-platform nature of Java programs; 2. Memory management, JVM acts as a Java application The middle layer between the program and the underlying operating system, providing cross-platform features and more.
 Java Error: JVM memory overflow error, how to deal with and avoid
Jun 24, 2023 pm 02:19 PM
Java Error: JVM memory overflow error, how to deal with and avoid
Jun 24, 2023 pm 02:19 PM
Java is a popular programming language. During the development of Java applications, you may encounter JVM memory overflow errors. This error usually causes the application to crash, affecting the user experience. This article will explore the causes of JVM memory overflow errors and how to deal with and avoid such errors. What is JVM memory overflow error? The Java Virtual Machine (JVM) is the running environment for Java applications. In the JVM, memory is divided into multiple areas, including heap, method area, stack, etc. The heap is used to store created objects
 Demystifying the working principle of JVM: In-depth exploration of the principles of Java virtual machine
Feb 18, 2024 pm 12:28 PM
Demystifying the working principle of JVM: In-depth exploration of the principles of Java virtual machine
Feb 18, 2024 pm 12:28 PM
Detailed explanation of JVM principles: In-depth exploration of the working principle of the Java virtual machine requires specific code examples 1. Introduction With the rapid development and widespread application of the Java programming language, the Java Virtual Machine (JavaVirtualMachine, referred to as JVM) has also become indispensable in software development. a part of. As the running environment for Java programs, JVM can provide cross-platform features, allowing Java programs to run on different operating systems. In this article, we will delve into how the JVM works
 Analysis of the functions and principles of JVM virtual machine
Feb 22, 2024 pm 01:54 PM
Analysis of the functions and principles of JVM virtual machine
Feb 22, 2024 pm 01:54 PM
An introduction to the analysis of the functions and principles of the JVM virtual machine: The JVM (JavaVirtualMachine) virtual machine is one of the core components of the Java programming language, and it is one of the biggest selling points of Java. The role of the JVM is to compile Java source code into bytecodes and be responsible for executing these bytecodes. This article will introduce the role of JVM and how it works, and provide some code examples to help readers understand better. Function: The main function of JVM is to solve the problem of portability of Java programs on different platforms.
 What is the garbage collection mechanism of jvm?
Feb 01, 2023 pm 02:02 PM
What is the garbage collection mechanism of jvm?
Feb 01, 2023 pm 02:02 PM
The garbage collection mechanism of jvm is GC (Garbage Collection), also called garbage collector. Basic principles of GC: Recycle objects that are no longer used in memory; the method used for recycling in GC is called the collector. Since GC needs to consume some resources and time, Java analyzes the life cycle characteristics of the object and follows the Objects are collected in the new generation and old generation to shorten the pause caused by GC to the application as much as possible.
