This article brings you the use cases (code) of the matplotlib module in Python. It has certain reference value. Friends in need can refer to it. I hope it will be helpful to you.
import matplotlib.pyplot as plt
import numpy as np
import requests
url='https://api.github.com/search/repositories?q=language:python&sort=stars'
r=requests.get(url)
print('数据访问状态值:',r.status_code)
print('成功,正常获取网站数据'if r.status_code==200 else '错误,无法获取数据')
response_dict=r.json()  #转换成字典
#print(response_dict)
repo_dicts=response_dict['items']
#print(repo_dicts)
names=[repo_dict['name']for repo_dict in repo_dicts]
print(names)
plot_dicts=[repo_dict['stargazers_count'] for repo_dict in repo_dicts]
print(plot_dicts)
x=np.arange(len(names)) #x轴
plt.bar(x,plot_dicts)   #y轴
plt.plot(x,plot_dicts,'rp--') #折线图
ax=plt.subplot()
ax.set_ylabel('stargazers_count') #y轴标题
ax.set_xlabel('Github Reponstorys')  #x轴标题
ax.set_xticks(x)  #设置每一个x的标题
ax.set_xticklabels(names,rotation=90) #给每一个柱子加上标题
ax.set_title('Github')
#plt.grid(linestyle='--')  #虚线为背景,一个’-‘为实线,俩个为虚线
#plt.show()
#保存图片
import os
imgPath = os.getcwd() + '/images/ch04_demo05_github.jpg'
plt.savefig(imgPath)
print('图片保存成功.')
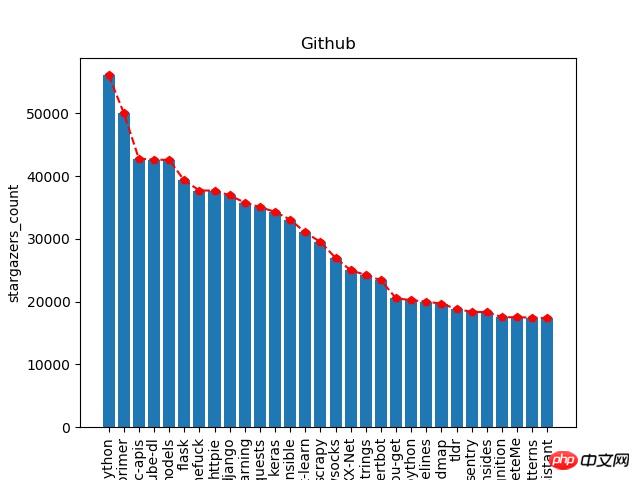
The result is:

This is actually relatively simple, just take out the json data and visualize it with matplotlib.
The above is the entire content of this article. For more exciting content about python, you can pay attention to the php Chinese website Python video tutorial and python article tutorial! ! !
The above is the detailed content of Use cases of matplotlib module in Python (code). For more information, please follow other related articles on the PHP Chinese website!