This article mainly introduces the installation of Xdebug in php5.6.34. It has certain reference value. Now I share it with you. Friends in need can refer to it.
Xdebug can be debugged with breakpoints in PHPstorm. Code~ is a very convenient plug-in tool~
##We first put it in the file list of PHPstorm Add an info.php file:

phpinfo();

##Right-click to view the source code and select all Copy and paste it into the text box of https://xdebug.org/wizard.php;
If the version is suitable, you can directly download Xdebug, but php5.6.34 will not work, and it will prompt that Xdebug does not support it. Versions lower than PHP7.0;
cannot find the
Xdebugadapted version. It is very troublesome to reinstall PHP7.0 and configure it, but XAMPP comes with it. php_xdebug.dll! So just download XAMPP to solve this problem.
Download and install
Okay(You can download it from the official website, the operation is simple)After XAMPP, open:

##After changing the file directory of zend_extension according to personal circumstances, After opening Copy and paste directly at the end of the file and add:
[Xdebug]
zend_extension = D:\xmapp\php\ext\php_xdebug.dll
xdebug.remote_enable=1
xdebug.remote_handler=dbgp
xdebug.remote_mode=req
xdebug.remote_host=localhost
xdebug.remote_port=9000
xdebug.idekey="PHPSTORM"
zend_extension = D:\xmapp\php\ext\php_xdebug.dll
followed by the relevant files in my own XAMPP installation path Address, that is, my XAMPP is installed directly under the D drive.
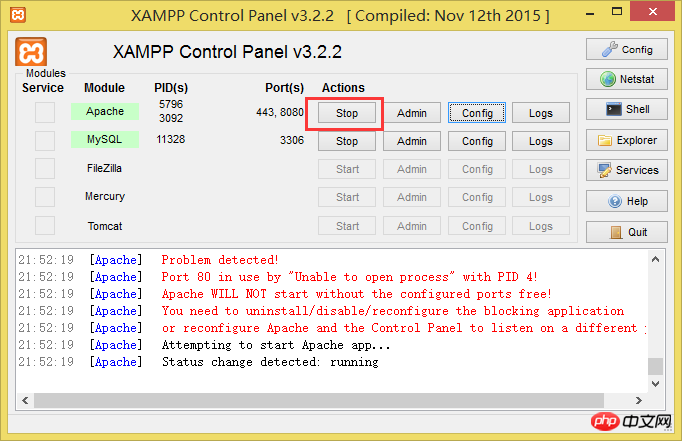
Restart Apache after saving the configuration file:
 ##Then Then refresh and open the info.php page in the browser, and you will see information like
##. The installation was successful~~
##Related recommendations:
##
The above is the detailed content of php5.6.34 install Xdebug. For more information, please follow other related articles on the PHP Chinese website!


