


The content shared with you in this article is about python knowledge analysis and dice throwing game. It has certain reference value. Friends in need can refer to it. I recently learned some statistics and python knowledge, and tried to analyze the dice game. The dice has a standard 6 sides, and the results of throwing 1, 2, 3, and 4 dice at a time, and throwing 10, 100, 1,000, and 10,000 times are analyzed.
use tools
Jupyter Notebook analysis tool
matplotlib, pygal visualization package
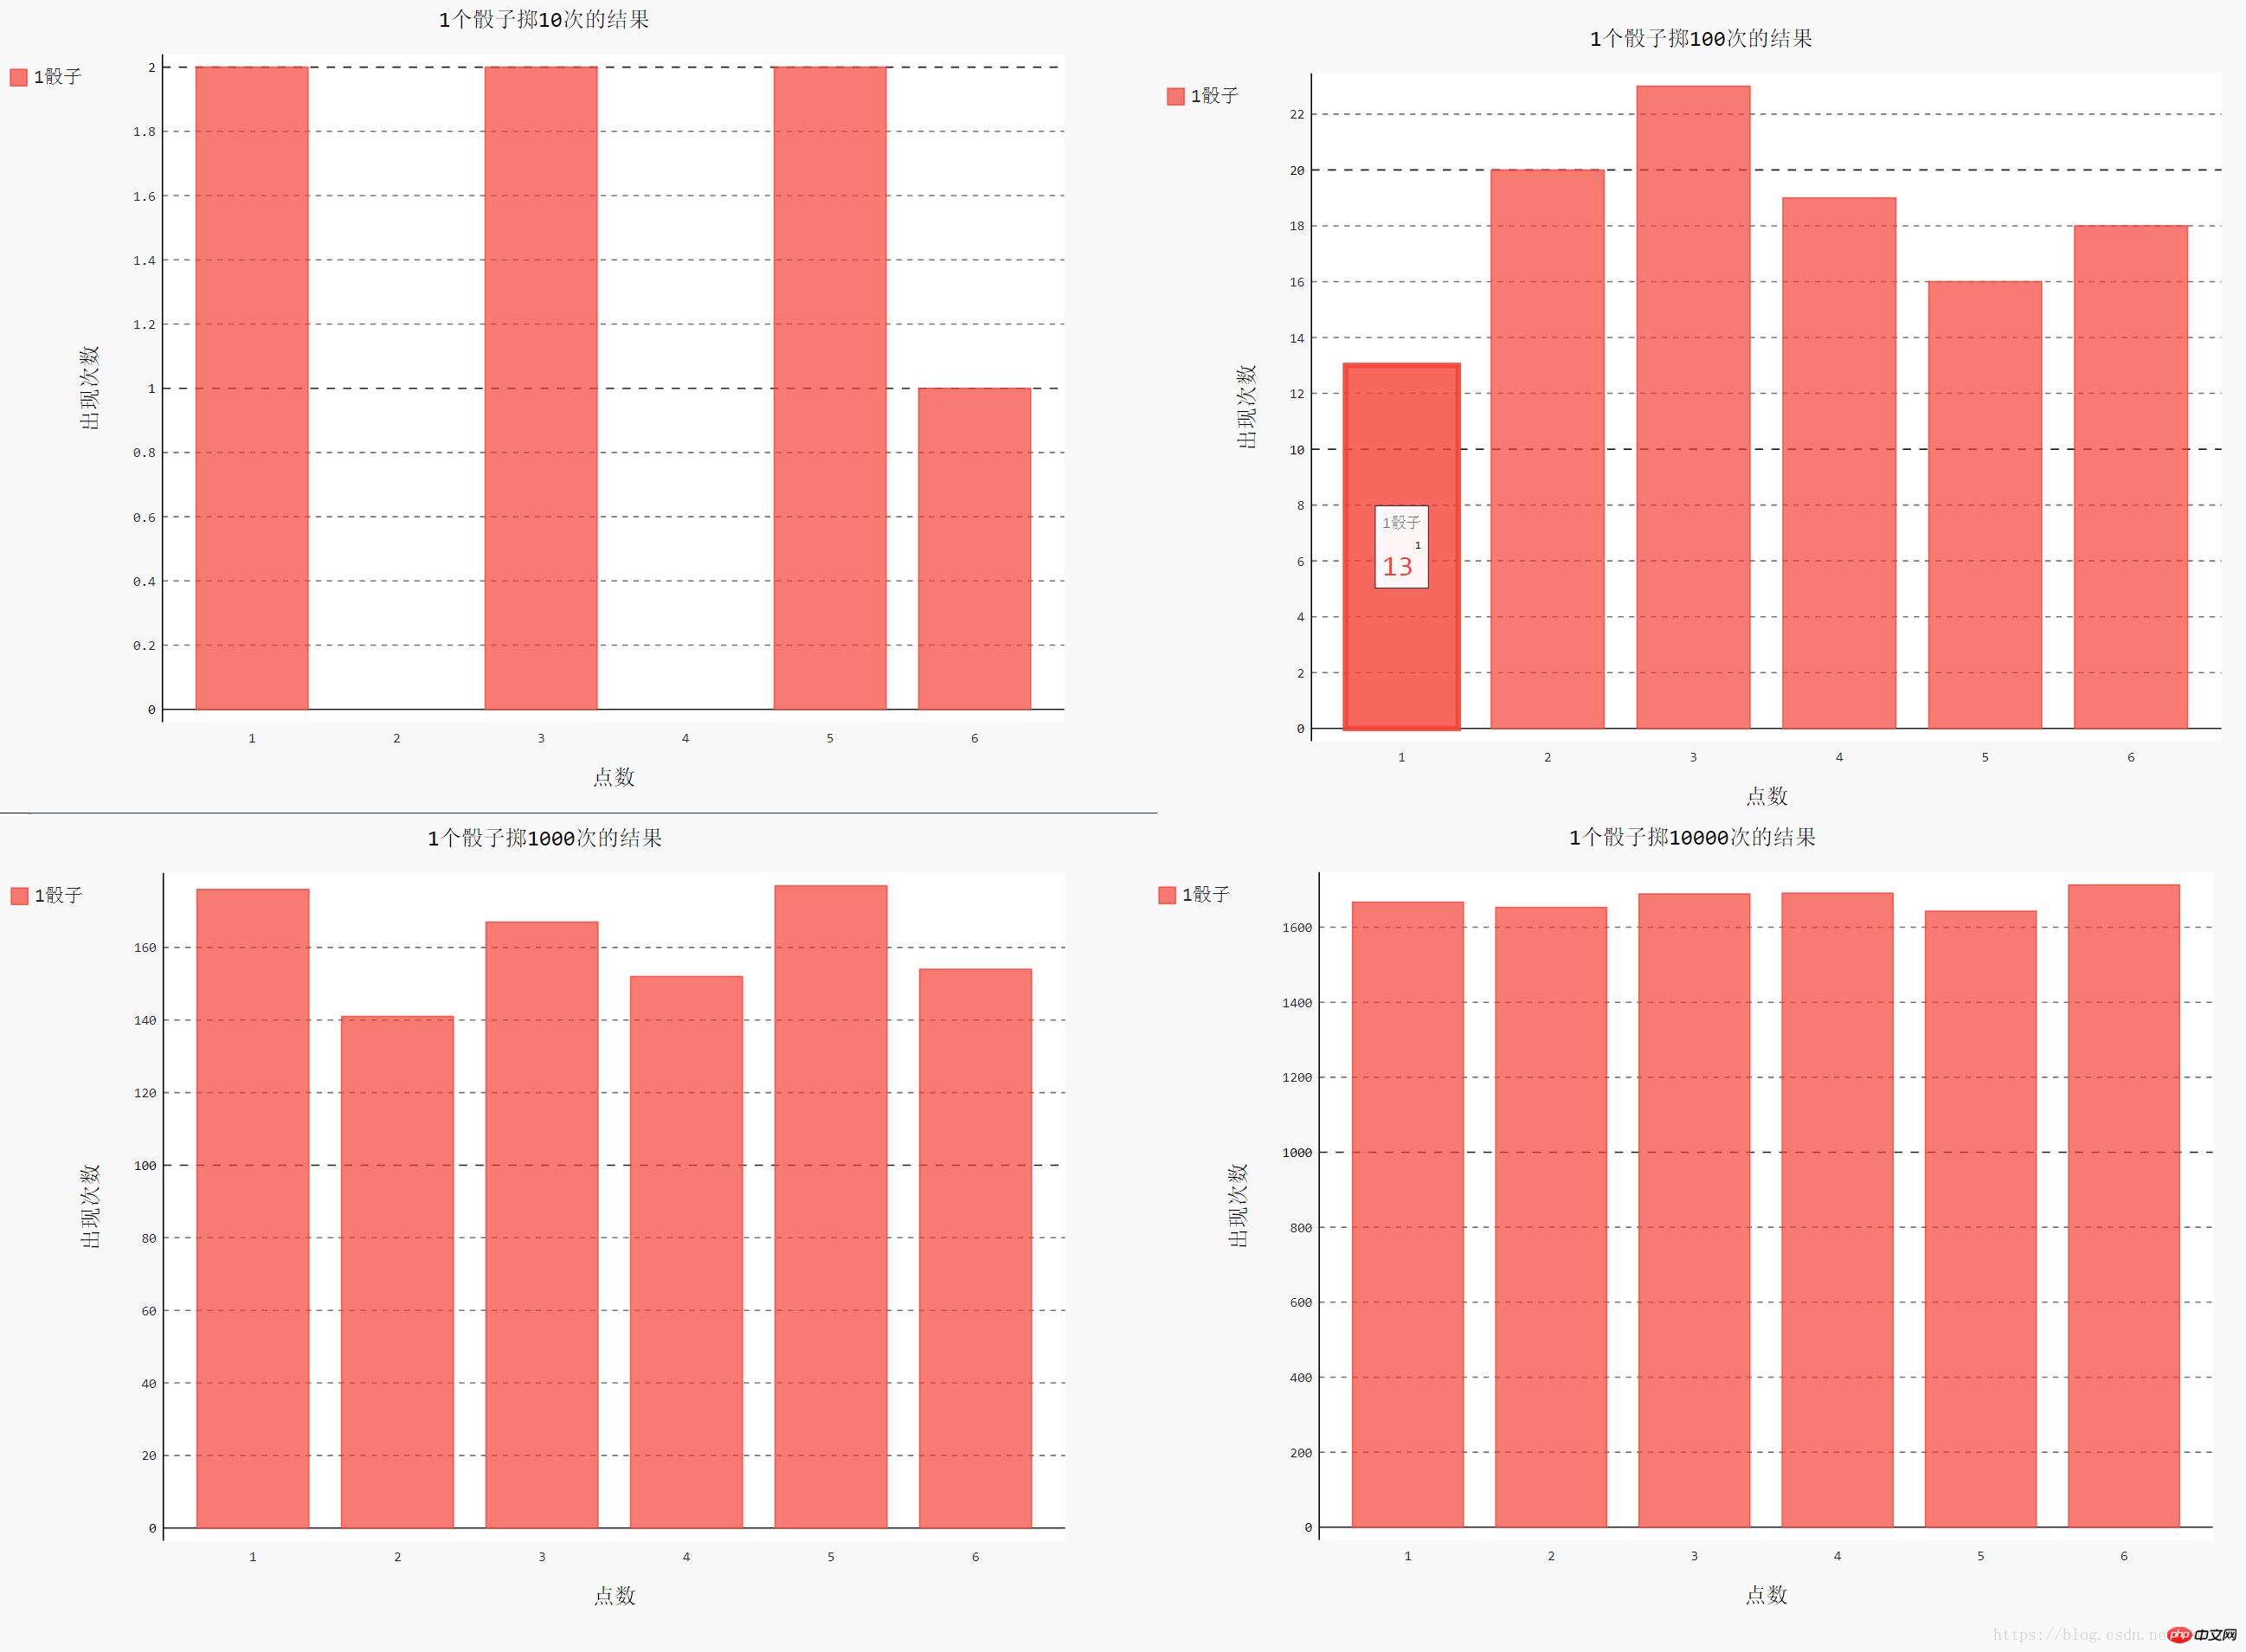
1-6中每个数字出现的次数
# 导入包
import pygal
import numpy as np
import matplotlib.pyplot as plt
plt.rcParams['font.sans-serif']=['SimHei'] # 用来正常显示中文标签
plt.rcParams['axes.unicode_minus']=False # 用来正常显示负号
from random import randint
# 利用随机数据模拟掷骰子
# 每次显示1-6中的一个数

num_sides = 6  # 骰子的6个面
def getData(N, times):
    """
    定义函数,获取投掷数据
    N: 表示一次用几个骰子投
    times:表示总共投几次
    """
    results = []
    for n in range(1,N+1):
        for roll_num in range(times):
            result = randint(1,num_sides)
            results.append(result)
return results# 打印投掷结果 print(getData(1,10)) # 1个骰子掷10次 print(getData(2,5)) # 2个骰子掷5次
[2, 2, 2, 2, 1, 6, 4, 4, 5, 5]
[4, 3, 5, 6, 2, 2, 3, 6, 4, 4]
# 分析结果# 统计每个数字出现的次数并显示图片
    # N: 表示一次用几个骰子投
    # data 表示投掷数据def showResult(N, times):
    frequencies = []    for value in range(1, num_sides+1):
        frequency = getData(N, times).count(value)
        frequencies.append(frequency)    # 数据可视化
    # 本次利用 pygal 生成SVG格式矢量图
    hist = pygal.Bar()
    hist.title = str(N)+"个骰子掷"+ str(times) +"次的结果"
    hist.x_labels = ['1','2','3','4','5','6']
    hist.x_title = "点数"
    hist.y_title = "出现次数"

    hist.add(str(N)+'骰子', frequencies)
hist.render_to_file('1-'+str(N)+str(times)+'.svg') # 储存为矢量图# 一个骰子掷10,100, 1000, 10000次结果分析showResult(1,10) showResult(1,100) showResult(1,1000) showResult(1,10000)
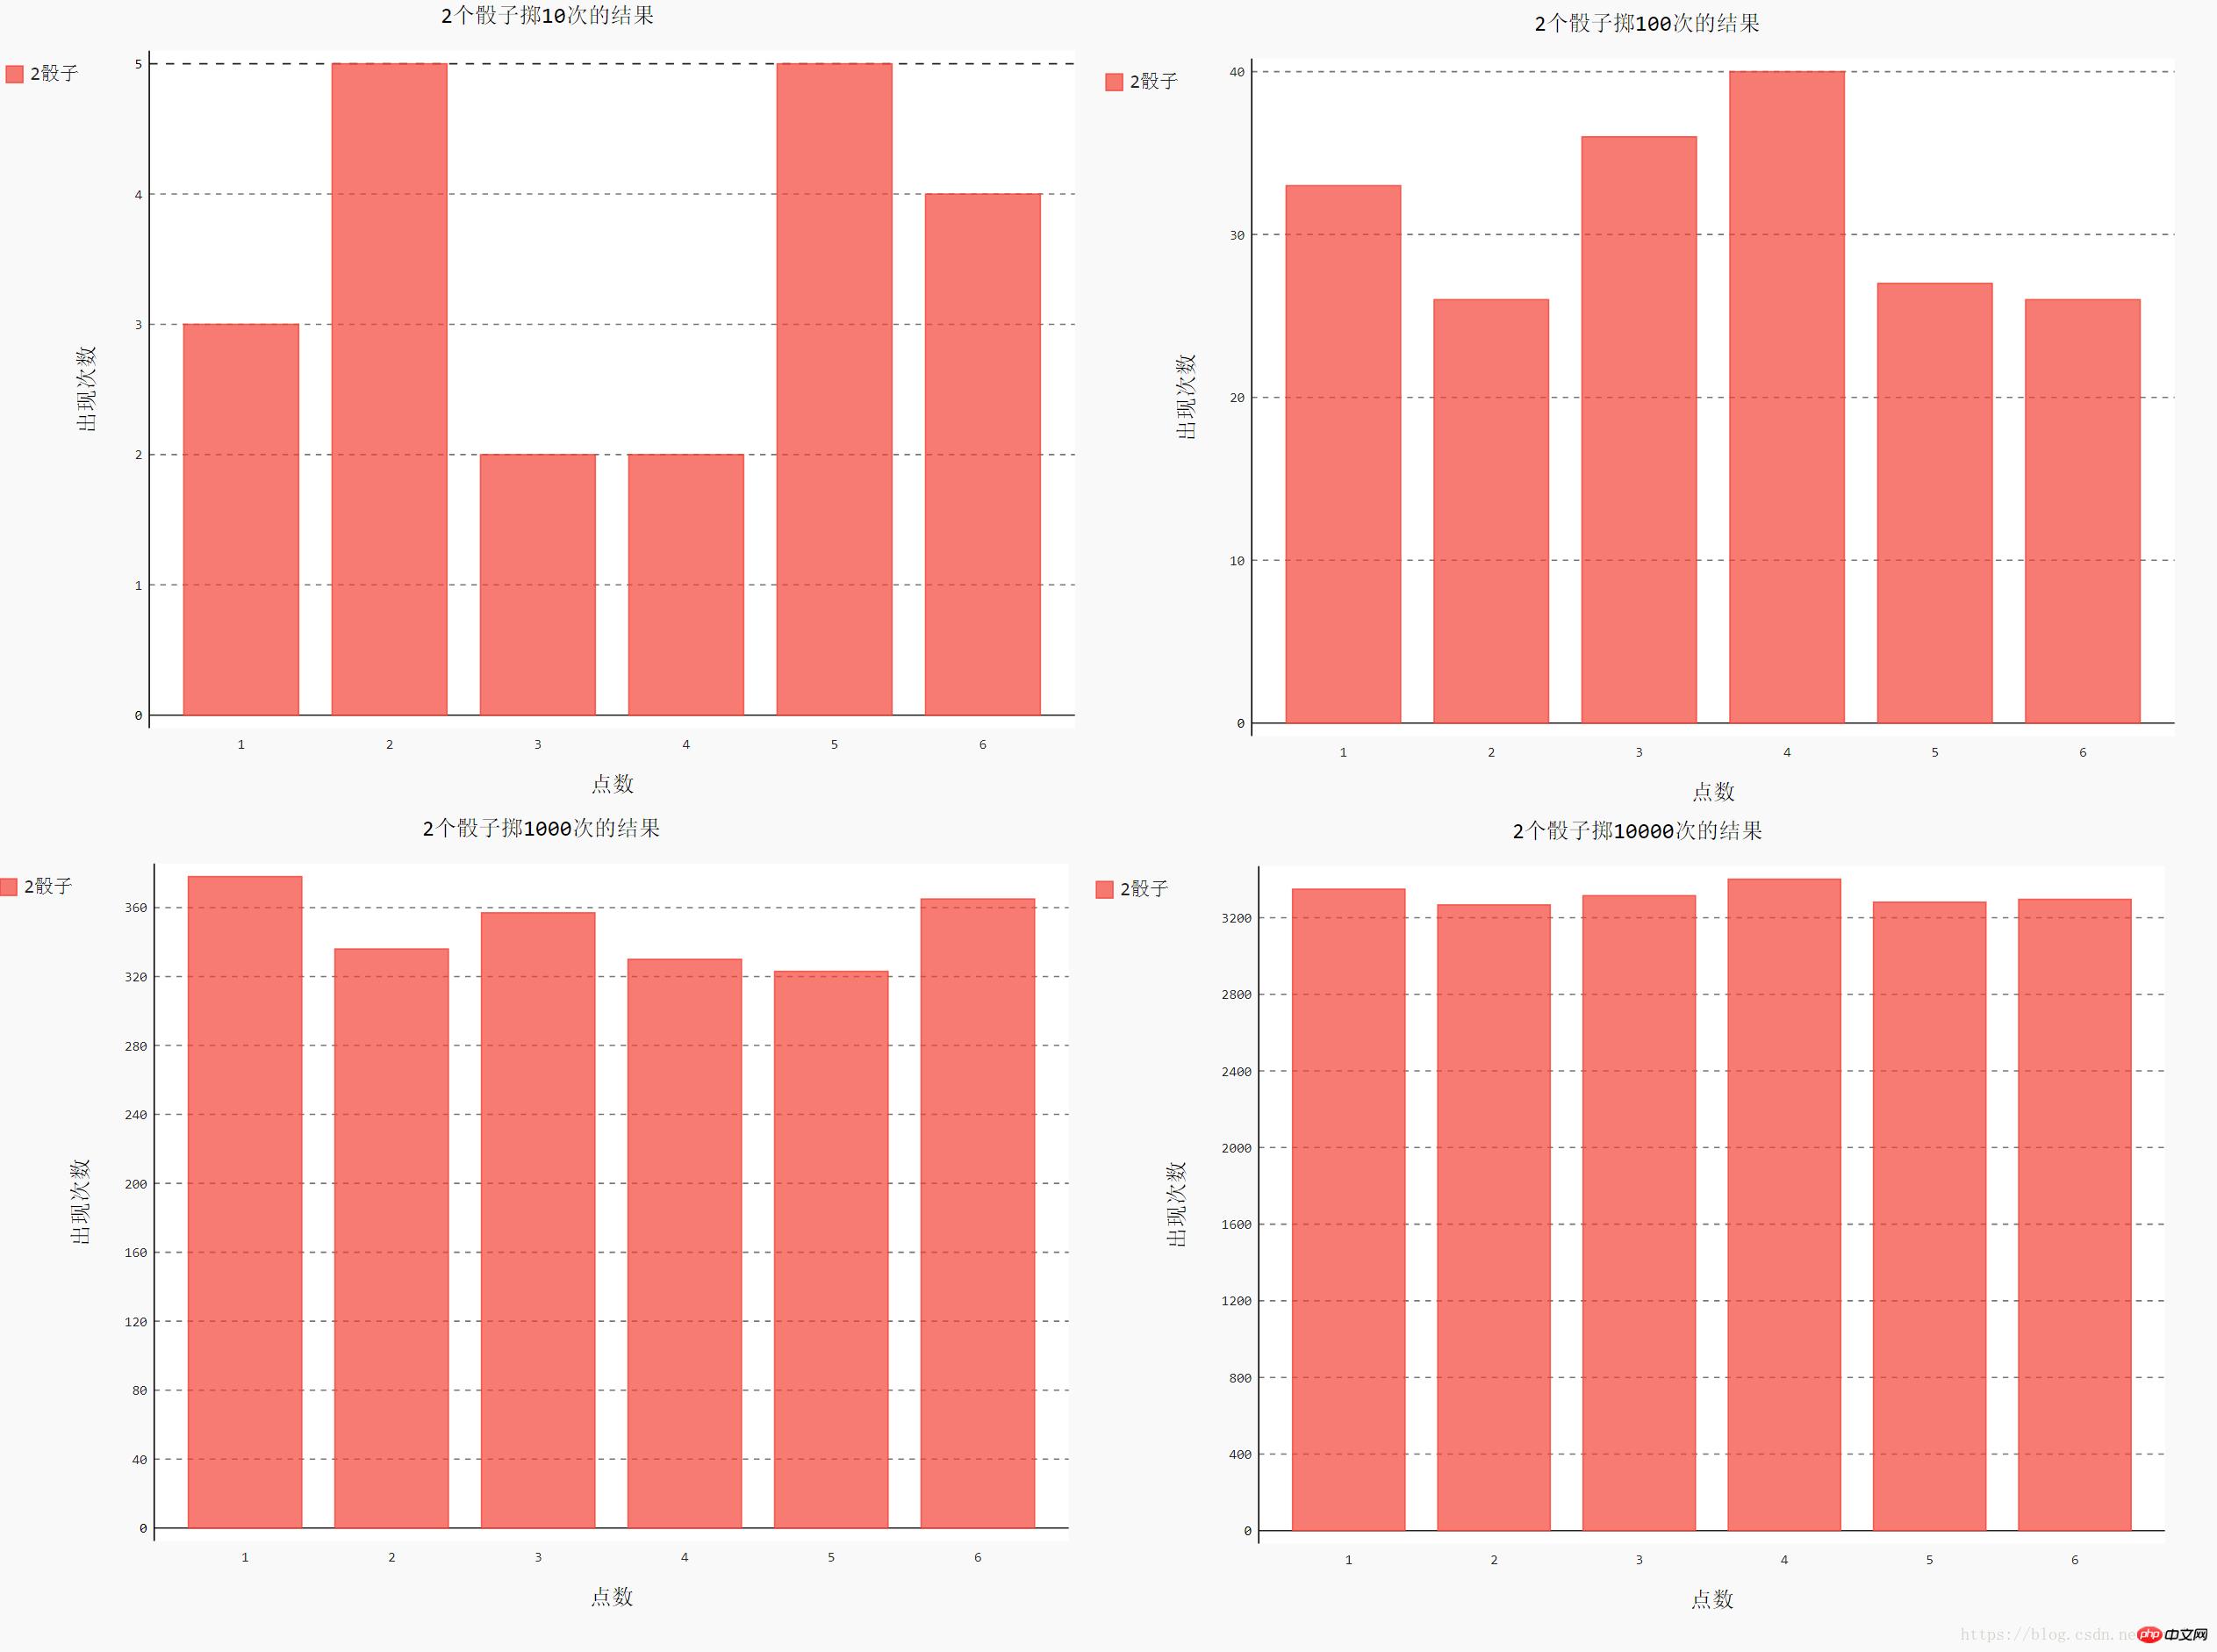
# 2个骰子掷10,100, 1000, 10000次结果分析showResult(2,10)
showResult(2,100)
showResult(2,1000)
showResult(2,10000)
3 dice , 4 dice will no longer take screenshots.
We found that the more times we throw, the closer the probability of each number appears, and finally tend to be the same.
每次投掷点数和
# 每次投掷点数和def getData2(N, times):
    """
    定义函数,获取投掷数据
    N: 表示一次用几个骰子投
    times:表示总共投几次
    """
    results = []    for roll_num in range(times):
        result = 0
        for n in range(1,N+1):
            result += randint(1,num_sides)
        results.append(result)
return results# 打印投掷结果print(getData2(1,10)) # 1个骰子掷10次print(getData2(2,5)) # 2个骰子掷5次
[4, 3, 6, 2, 5, 4, 5, 3, 6, 2]
[6, 10, 5, 8, 7]
# 分析结果# 统计数字和出现的次数并显示图片
    # N: 表示一次用几个骰子投
    # data 表示投掷数据def showResult2(N, times):
    frequencies = []    for value in range(N, N*num_sides+1):
        frequency = getData2(N, times).count(value)
        frequencies.append(frequency)    # 数据可视化
    # 本次利用 matplotlib 生成图片
    x_num = N*num_sides+1-N
    idx = np.arange(x_num)
    width = 0.5
    sn = str(N)
    sm = str(times)
    x_labels = [str(n) for n in range(N, N*num_sides+1)]  # X轴刻度

    plt.bar(idx, frequencies, width, color='red', label=sn+'个骰子')
    plt.xlabel('点数和')
    plt.ylabel('出现次数')
    plt.title(sn+'个骰子投掷'+ sm +'次的结果')
    plt.xticks(idx, x_labels)
    plt.legend()  # 显示图例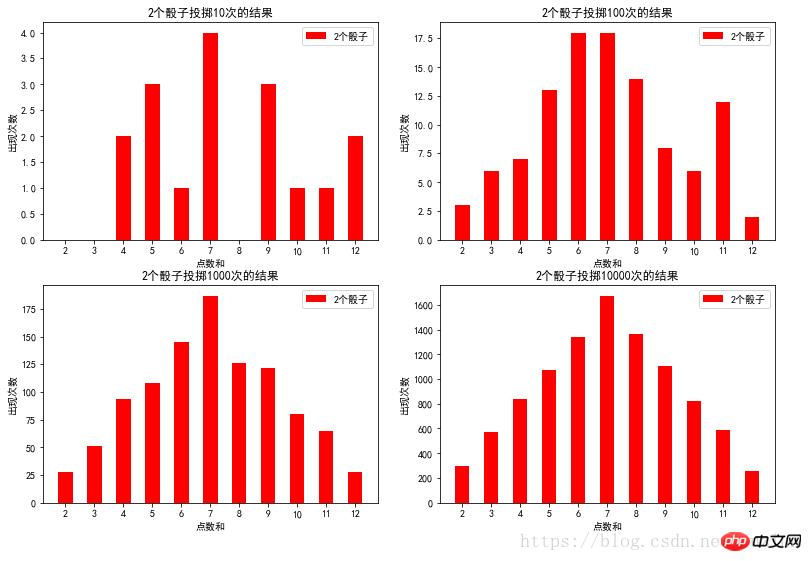
plt.show()It doesn’t make much sense to guess the size of one dice. Let’s directly analyze the situation of two dice.
#  2个骰子掷10,100, 1000, 10000次结果分析showResult2(2,10)
showResult2(2,100)
showResult2(2,1000)
showResult2(2,10000)
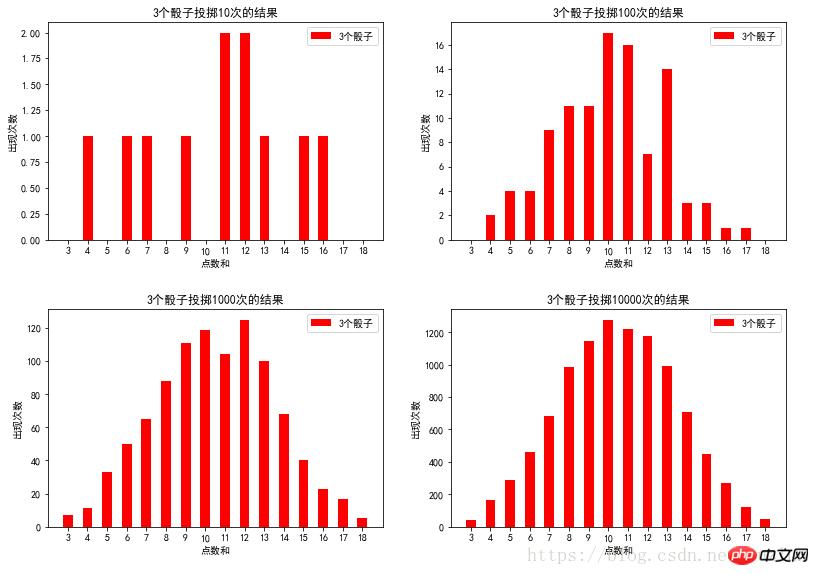
#  3个骰子掷10,100, 1000, 10000次结果分析showResult2(3,10)
showResult2(3,100)
showResult2(3,1000)
showResult2(3,10000)
#  4个骰子掷10,100, 1000, 10000次结果分析showResult2(4,10)
showResult2(4,100)
showResult2(4,1000)
showResult2(4,10000)
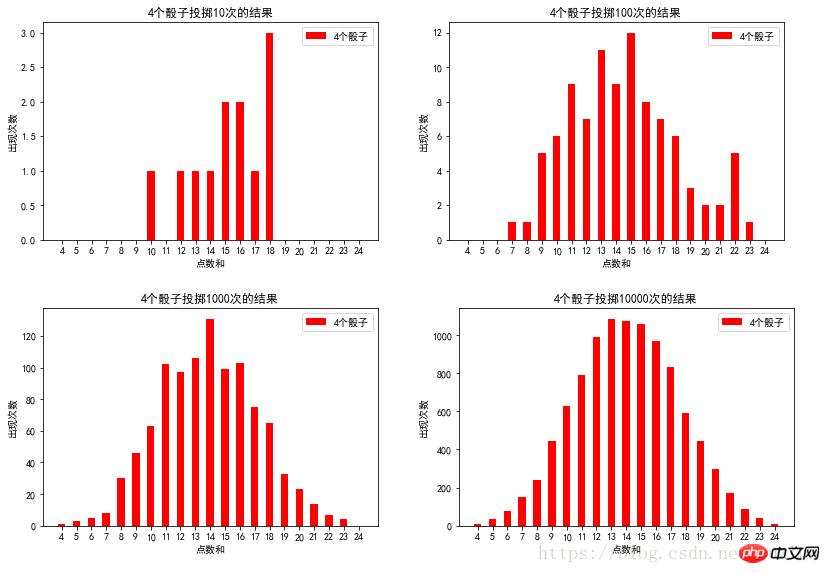
We can see from the above pictures that when the number of throws is enough Often, the probability of large/small points appearing is basically the same, and the point size shows the characteristics of a normal distribution.
Related recommendations:
dice rolling game-C language implementation
practicing small Program: craps craps game
The above is the detailed content of python knowledge analysis dice game. For more information, please follow other related articles on the PHP Chinese website!


![[Web front-end] Node.js quick start](https://img.php.cn/upload/course/000/000/067/662b5d34ba7c0227.png)


