


Python’s functions cannot be said to be insignificant, and it has very convenient applications in financial data analysis. The content of this article is to share with you the acquisition and simple processing of financial data in Python. It has certain reference value. Friends in need can refer to it
The pandas package has its own data acquisition interface. For details, you can go to its official website to find it. It is the DataReader method under io.data.
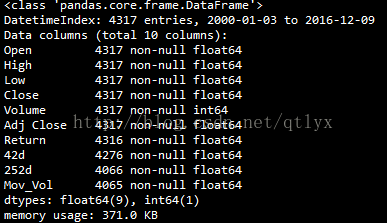
import numpy as np import pandas as pd import pandas.io.data as web import math #从雅虎财经获取DAX指数的数据 DAX = web.DataReader(name='^GDAXI', data_source='yahoo',start = '2000-1-1') #查看一下数据的一些信息 上面这一方法返回的是一个pandas dataframe的数据结构 print DAX.info() #绘制收盘价的曲线 DAX['Close'].plot(figsize=(8,5))
The data we obtain is the structure of dataframe, after all, it is the interface of pandas. Then we draw the closing price curve.
This is the information of the data we obtained.
The closing price curve drawn is like this.
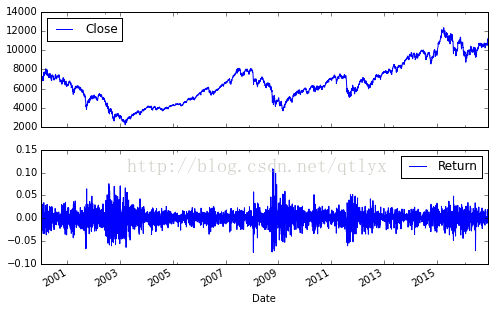
With the stock price, we will calculate the daily rise and fall. , in other words, is the daily rate of return, as well as the moving average of the stock price and the volatility of the stock price.
##
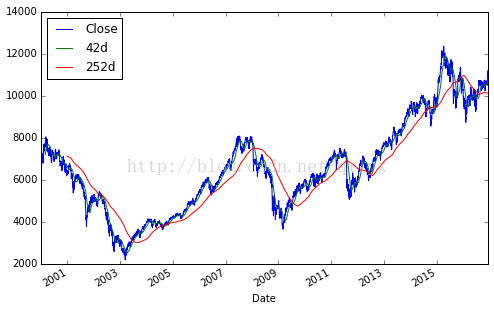
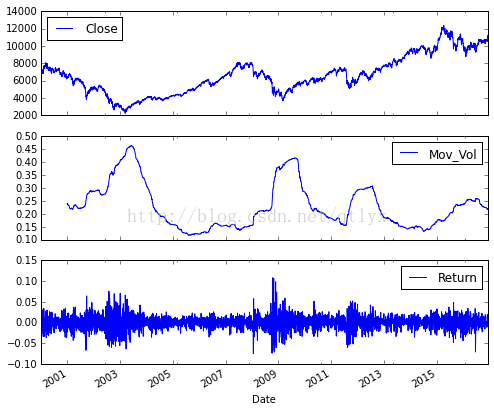
#计算每日的涨跌幅 DAX['Return'] = np.log(DAX['Close']/DAX['Close'].shift(1)) print DAX[['Close','Return']].tail() #将收盘价与每日涨跌幅度放在一张图上 DAX[['Close','Return']].plot(subplots = True,style = 'b',figsize=(8,5)) #42与252个交易日为窗口取移动平均 DAX['42d']=pd.rolling_mean(DAX['Close'],window=42) DAX['252d']=pd.rolling_mean(DAX['Close'],window=252) #绘制MA与收盘价 DAX[['Close','42d','252d']].plot(figsize=(8,5)) #计算波动率,然后根据均方根法则进行年化 DAX['Mov_Vol']=pd.rolling_std(DAX['Return'],window = 252)*math.sqrt(252) DAX[['Close','Mov_Vol','Return']].plot(subplots = True, style = 'b',figsize = (8,7))
##We can master this kind of subplots Drawing method, put together several trend pictures.
This is a picture of the moving average. The attribute of subplots is false. Then they are drawn together.
Python in finance, data Analysis, and applications in artificial intelligence
##Use Python to obtain Google, Yahoo financial data toolsThe above is the detailed content of Python's acquisition and simple processing of financial data. For more information, please follow other related articles on the PHP Chinese website!


![[Web front-end] Node.js quick start](https://img.php.cn/upload/course/000/000/067/662b5d34ba7c0227.png)


