


Python的拿手好戏是解决数据分析和可视化问题,本篇文章给大家分享的是python代码画出爱心曲线的操作详解,内容挺不错的,希望可以帮助到有需要的朋友。
先不急着画爱心线,来看如何画函数曲线。
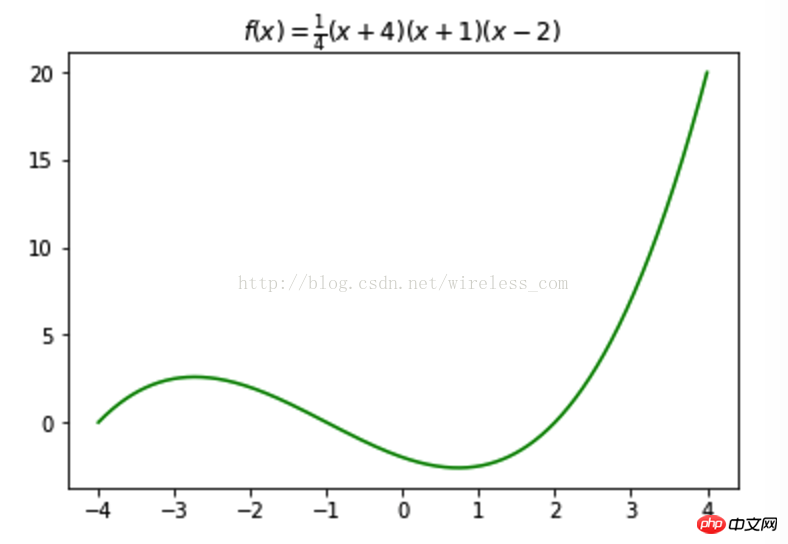
例如,画出指定区间的一个多项式函数:
Python 代码如下:
import numpy as np
import matplotlib.pyplot as plt
X = np.linspace(-4, 4, 1024)
Y = .25 * (X + 4.) * (X + 1.) * (X - 2.)
plt.title('$f(x)=\\frac{1}{4}(x+4)(x+1)(x-2)$')
plt.plot(X, Y, c = 'g')
plt.show()通过numpy的linspace方法来确定横坐标x的取值范围,列出方程,然后调用matplotlib的pyplot画出函数曲线即可。numpy 是一个用python实现的科学计算包,包括一个强大的N维数组对象Array和成熟的函数库,有用于整合C/C++和Fortran代码的工具包,提供了实用的线性代数、傅里叶变换和随机数生成函数等工具,可以理解成Matlab。
记得中学的时候,我问老师三角函数到底有啥用?(无知者无畏)老师反问我,“如果给了你一块洋铁,怎样才能剪出煤炉烟囱的拐弯呢?”,现在仍然记得老师的这个例子,哪些看似抽象的数学公式,实际上是自己不知道她们的应用场景而已。

Python代码如下:
import numpy as np
import matplotlib.pyplot as plt
X = np.linspace(0, 2 * np.pi, 100)
YSinValues = np.sin(X)
YCosValues = np.cos(X)
plt.plot(X, YSinValues)
plt.plot(X, YCosValues)
plt.show()
Matplotlib 是一个 Python 的 2D绘图库,甚至可以生成出版质量级别的图形。
对于那些正态分布而言,Python 画起来也就相当简单了:
import numpy as np
import matplotlib.pyplot as plt
def pdf(X, mu, sigma):
    a = 1. / (sigma * np.sqrt(2. * np.pi))
    b = -1. / (2. * sigma ** 2)
    return a * np.exp(b * (X - mu) ** 2)
X = np.linspace(-6, 6, 1000)
for i in range(3):
    samples = np.random.standard_normal(10)
    mu, sigma = np.mean(samples), np.std(samples)
    plt.plot(X, pdf(X, mu, sigma), color = '.66')
plt.plot(X, pdf(X, 0., 1.), color = 'b')
plt.show()
为了不显得单调,这里多画了几条曲线。只要算出方差和均值,从excel中读出哪些数值就可以拟合正态分布了。

回归到主题,关于爱心线,有这样一个凄美的爱情故事。
迩来流浪于吴越,一片闲云空皎洁。
More than 300 years ago, on the streets of Stockholm, the down-and-out Descartes lived a life of begging, with all his property including tattered clothes and a few mathematics books with him. The aloof Descartes did not ask for charity from passers-by, but silently lowered his head to write and draw on paper, immersed in his mathematical world. On a quiet afternoon, Descartes sat in the sunshine on the street and studied mathematical problems as usual. The passing crowds and the noisy carriages and horses could not interfere with him.
There is a beautiful person, graceful and clear. We meet each other by chance, and we meet each other by chance.
"What are you doing?" Turning his head, Descartes saw a young and beautiful face, a pair of clear eyes like blue lake water, as charming as the little princess of Sweden. Christine, the king's favorite daughter. She knelt down, took Descartes' mathematics book and scratch paper, and started talking to him. During the conversation, he discovered that this little girl was quick-thinking and had a strong interest in mathematics.
A few days later, Descartes unexpectedly received a notice that the king hired him to be the little princess’s math teacher. Full of doubts, Descartes followed the guards to the palace. He heard a silver bell-like laughter coming from a distance. He saw the girl he met by chance on the street that day, and from then on, he became the princess's math teacher.
Love doesn’t know where it started, but it goes deeper
The princess’s mathematics improved by leaps and bounds under Descartes’ careful guidance, and the relationship between them also began to develop. Become intimate. Descartes introduced her to the rectangular coordinate system, which allowed algebra and geometry to be combined, which was the prototype of analytic geometry that Descartes would later create. Under the guidance of Descartes, Christine entered the wonderful world of coordinates, and she became fascinated by curves. Being inseparable every day also made them fall in love with each other.
In Sweden, a romantic country, a pure and beautiful love quietly sprouted.
Thinking about it again and again, thousands of miles of misty waves, the dusk is sinking and the sky is vast.
When news of their love affair reached the king's ears, the king was furious and ordered Descartes to be executed. At Christine's pleading, the king banished him back to his country, and the princess was placed under house arrest in the palace.
At that time, the Black Death was spreading across the European continent. Shortly after Descartes returned to France, he fell seriously ill. During the days when his life was counting down, what he missed day and night was the warm smiling face he met by chance on the street. He kept writing to her every day, looking forward to her reply. However, these letters were intercepted by the king, and the princess never received any news from him.
If you want to know what is in your heart, read the book in your belly.
在笛卡尔给克里斯汀寄出第十三封信后,他永远地离开了这个世界。此时,被软禁在宫中的小公主依然徘徊在皇宫的走廊里,思念着远方的情人。
这最后一封信上没有写一句话,只有一个方程:r=a(1-sinθ)。
国王以为这个方程里隐藏着两个人的秘密,便把全城的数学家召集到皇宫,但是没有人能解开这个函数式。他不忍看着心爱的女儿每天闷闷不乐,便把这封信给了她。拿到信的克里斯汀欣喜若狂,她立即明白了恋人的意图,找来纸和笔,把图形画了出来,一颗心形图案出现在眼前,克里斯汀泪流满面,这条曲线就是著名的“心形线”。
国王去世后,克里斯汀继承王位,便立刻派人去法国寻找心上人的下落,收到的却是笛卡尔去世的消息,留下了一个永远的遗憾…… 这封享誉世界的另类情书,据说至今还保存在欧洲笛卡尔的纪念馆里。
这个故事的出处无从知道,网络上流传着各种各样的版本,甚至在百度百科也有着这个故事。后来,有人考证了真实性,认为这是一个美丽的谎言,但并不妨碍人们对爱心线喜爱。
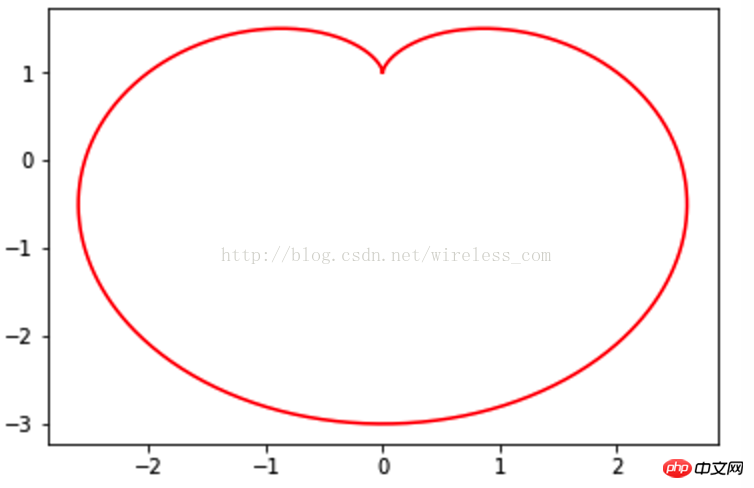
在直角坐标系中,爱心线的方程的python 表达为:x** 2+ y** 2 + a * x= a * sqrt(x** 2+y** 2) 和 x** 2+ y** 2 - a * x= a * sqrt(x** 2+y** 2)通过x 来求对应的y值很麻烦,就像软件设计中的“万能层”那样,可以采用参数方程来表示:
x=a*(2*cos(t)-cos(2*t))
y=a*(2*sin(t)-sin(2*t))
具体的python代码如下:
import numpy as np
import matplotlib.pyplot as plt
a = 1
t = np.linspace(0 , 2 * np.pi, 1024)
X = a*(2*np.cos(t)-np.cos(2*t))
Y = a*(2*np.sin(t)-np.sin(2*t))
plt.plot(Y, X,color='r')
plt.show()
代表爱心的心形线来了:
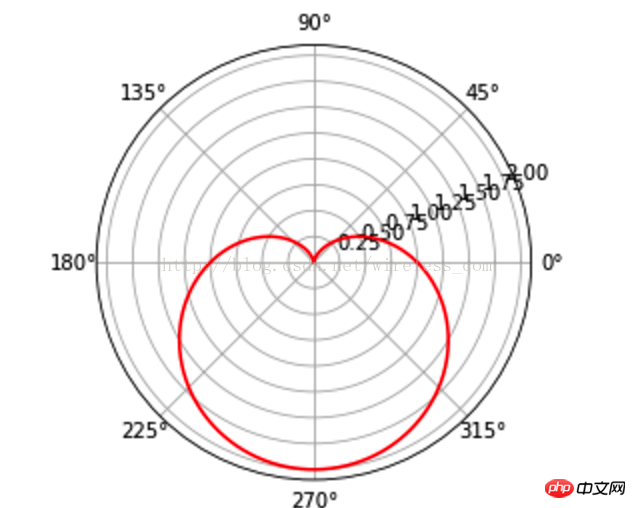
但这不是六行代码呀?也不是r=a(1-sinθ)呀? 的确如此,那是极坐标系,python 的matplotlib同样支持极坐标系的,爱心线的六行pyton代码如下:
import numpy as np
import matplotlib.pyplot as plt
T = np.linspace(0 , 2 * np.pi, 1024)
plt.axes(polar = True)
plt.plot(T, 1. - np.sin(T),color="r")
plt.show()
这样,得到的就是封面中的图像了:
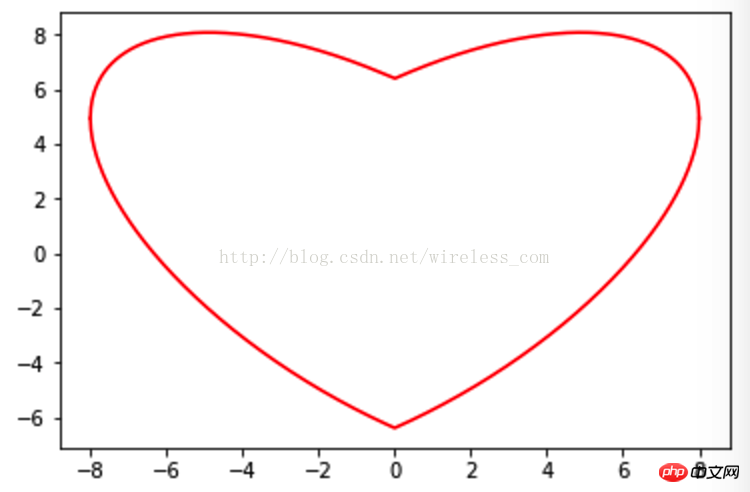
心形线确实是爱心满满,如果融入了忧伤会是怎样呢?
import numpy as np
import matplotlib.pyplot as plt

x = np.linspace(-8 , 8, 1024)
y1 = 0.618*np.abs(x) - 0.8* np.sqrt(64-x**2)
y2 = 0.618*np.abs(x) + 0.8* np.sqrt(64-x**2)
plt.plot(x, y1, color = 'r')
plt.plot(x, y2, color = 'r')
plt.show()
这样就得到了另一个爱心线:
There are various beautiful implementations of love lines on the Internet, and they are also full of various emotions, but for each of them, basically they can be implemented relatively simply using Python.
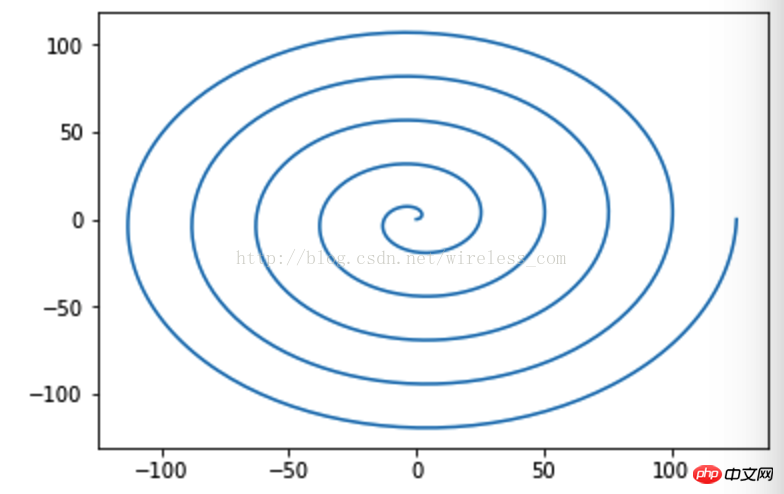
In fact, drawing is very simple. What is difficult is the expression of those curve equations and the actual application scenario requirements, such as Helix.
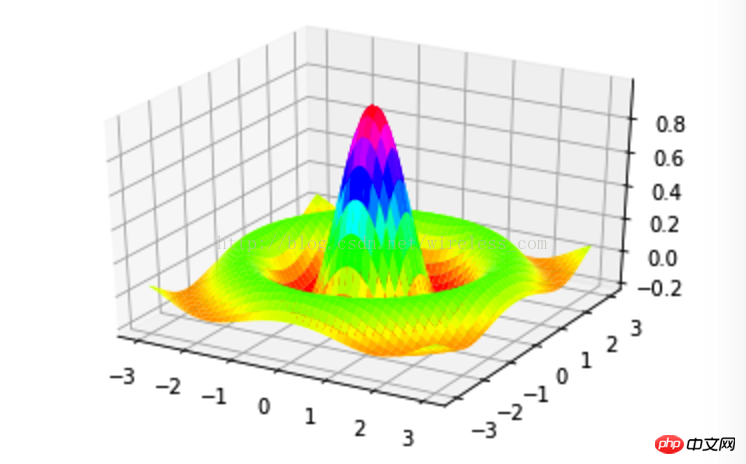
further, You can also draw various 3D views, such as:
##Summary:
As the last link in data analysis and even big data processing, it is the so-called visualization of insights, and python can be said to be one of them. Simple and practical tool.The above is the detailed content of Python code draws a love curve. For more information, please follow other related articles on the PHP Chinese website!


![[Web front-end] Node.js quick start](https://img.php.cn/upload/course/000/000/067/662b5d34ba7c0227.png)


