Understanding and measuring HTTP times helps us discover performance bottlenecks in client-to-server or server-to-server communication. This article explains the time overhead in HTTP requests and shows how to measure it in Node.js.
Before we start to understand HTTP time overhead, let us look at some basic concepts:
IP (Internet Protocol): IP is a network layer protocol that involves the network Addressing and routing. IP is responsible for delivering packets from source hosts to destination hosts based on packet headers on one or more IP networks. It also defines the packet structure that encapsulates the data to be delivered.
DNS (Domain Name Server): DNS is a hierarchical decentralized naming system used to resolve human-readable hostnames such as risingstack.com into machine-readable IP addresses .
TCP (Transmission Control Protocol): The TCP standard defines how to establish and maintain network conversations between applications to exchange data. TCP provides a reliable, ordered, and error-checked stream of octets between applications running on hosts communicating over IP networks. HTTP clients initiate requests by establishing a TCP connection.
SSL/TLS (Transport Layer Security): TLS is an encryption protocol that provides communication security over a computer network. SSL (Secure Sockets Layer) is the deprecated predecessor of TLS. Both TLS and SSL use certificates to establish secure connections. SSL certificates do not rely on encryption protocols (such as TLS), and the certificate contains a key pair: a public key and a private key. These keys work together to establish an encrypted connection.
Now let’s look at the timeline for a typical HTTP request:

DNS lookup : The time spent performing DNS lookups. DNS lookups resolve domain names into IP addresses. Each new domain requires a complete round trip for a DNS lookup. When the destination is already an IP address, there is no DNS lookup.
TCP Connection: The time required to establish a TCP connection between the source host and the destination host. The connection must be established correctly during the multi-step handshake. TCP connections are managed by the operating system, and if the underlying TCP connection cannot be established, OS-wide TCP connection timeouts will go into the timeout configuration in our application.
TLS Handshake: Time to complete the TLS handshake. During the handshake, the endpoints exchange authentication and keys to establish or resume a secure session. No TLS handshake is required for HTTPS requests.
Time to first byte (TTFB): The time to wait for the initial response. This time captures the latency to and from the server, in addition to the time spent waiting for the server to process the request and deliver the response.
Content transfer: The time spent receiving response data. The size of the response data and available network bandwidth determine its duration.
How to use HTTP time overhead to help find performance bottlenecks?
For example, if your DNS queries are taking longer than expected, the problem may be your DNS provider or DNS cache settings.
Slow content delivery can be caused by an inefficient reactive mechanism, such as sending back too much data (unused JSON attributes, etc.) or a slow connection.
Measuring HTTP time overhead in Node.js
In order to measure HTTP time overhead in Node.js, we need to subscribe to specific request, response and socket events. Here is a short code snippet showing how to do this in Node.js, this example focuses only on timing:
const timings = {
 // use process.hrtime() as it's not a subject of clock drift
 startAt: process.hrtime(),
 dnsLookupAt: undefined,
 tcpConnectionAt: undefined,
 tlsHandshakeAt: undefined,
 firstByteAt: undefined,
 endAt: undefined
 }

 const req = http.request({ ... }, (res) => {
 res.once('readable', () => {
  timings.firstByteAt = process.hrtime()
 })
 res.on('data', (chunk) => { responseBody += chunk })
 res.on('end', () => {
  timings.endAt = process.hrtime()
 })
 })
 req.on('socket', (socket) => {
 socket.on('lookup', () => {
  timings.dnsLookupAt = process.hrtime()
 })
 socket.on('connect', () => {
  timings.tcpConnectionAt = process.hrtime()
 })
 socket.on('secureConnect', () => {
  timings.tlsHandshakeAt = process.hrtime()
 })
})The DNS lookup will only happen if there is a domain name:
/ There is no DNS lookup with IP address
const dnsLookup = dnsLookupAt !== undefined ?
 getDuration(startAt, dnsLookupAt) : undefined
TCP connection happens immediately after host resolution:
const tcpConnection = getDuration((dnsLookupAt || startAt), tcpConnectionAt)
TLS handshake (SSL) can only use https protocol:
// There is no TLS handshake without https
const tlsHandshake = tlsHandshakeAt !== undefined ?
  getDuration(tcpConnectionAt, tlsHandshakeAt) : undefined
We wait for the server to start sending the first byte:
const firstByte = getDuration((tlsHandshakeAt || tcpConnectionAt), firstByteAt)
The total duration is calculated from the start and end dates:
const total = getDuration(startAt, endAt)
To see the full example, take a look at our https://github.com/RisingStac... repository.
Tools to measure time
Now that we know how to measure HTTP time using Node, let’s discuss the existing tools that can be used to understand HTTP requests.
request module
The famous request module has built-in methods for measuring HTTP timing. You can enable it using the time attribute.
const request = require('request')

request({
 uri: 'https://risingstack.com',
 method: 'GET',
 time: true
}, (err, resp) => {
 console.log(err || resp.timings)
})Distributed Tracing
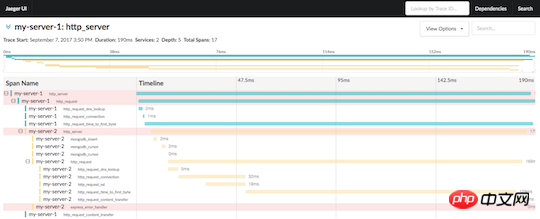
You can use distributed tracing tools to collect HTTP timings and visualize them on a timeline. This way, you can get a complete picture of what's going on behind the scenes and how much it actually costs to build a distributed system.
RisingStack's opentracing-auto library has built-in flags to collect all HTTP times via OpenTracing.

HTTP request timing using opentracing-auto in Jaeger.
Summary
Measuring HTTP time using Node.js can help you find performance bottlenecks. The Node ecosystem provides great tools to extract these metrics from applications.
Related recommendations:
Share several ways of sending HTTP requests in PHP
Analysis of similarities and differences in the main features of different versions of HTTP
Introduction to the http module and url module in node.js
The above is the detailed content of Node.js measures time spent on HTTP. For more information, please follow other related articles on the PHP Chinese website!


