


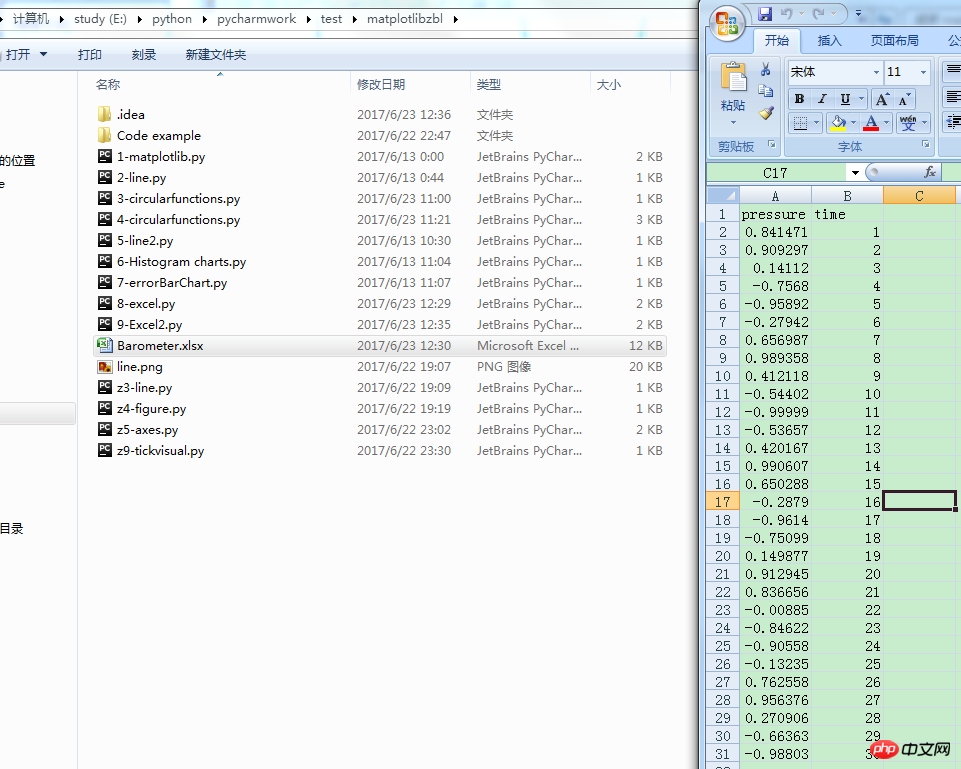
1 #!/usr/bin/env python 2 # -*- coding:utf-8 -*- 3 # __author__ = "blzhu" 4 """ 5 python study 6 Date:2017 7 """ 8 # coding=utf-8 9 #######################################################10 # filename:xlrd_draw.py11 # author:12 # date:xxxx-xx-xx13 # function:读excel文件中的数据14 #######################################################15 import numpy as np16 import matplotlib.pyplot as plt17 import xlrd18 19 # 打开一个workbook20 workbook = xlrd.open_workbook(r'E:\python\pycharmwork\test\matplotlibzbl\Barometer.xlsx')21 22 # 抓取所有sheet页的名称23 worksheets = workbook.sheet_names()24 print('worksheets is %s' % worksheets)25 26 # 定位到mySheet27 mySheet = workbook.sheet_by_name(u'Pressure')28 29 # get datas30 pressure = mySheet.col_values(0)31 print(pressure)32 time = mySheet.col(1)33 print('time1',time)34 time = [x.value for x in time]35 print('time2',time)36 37 38 # drop the 1st line of the data, which is the name of the data.39 pressure.pop(0)40 time.pop(0)41 42 # declare a figure object to plot43 fig = plt.figure(1)44 45 # plot pressure46 plt.plot(time,pressure)47 48 plt.title('Barometer')49 plt.ylabel('Pa')50 plt.xticks(range(len(time)),time)51 plt.show()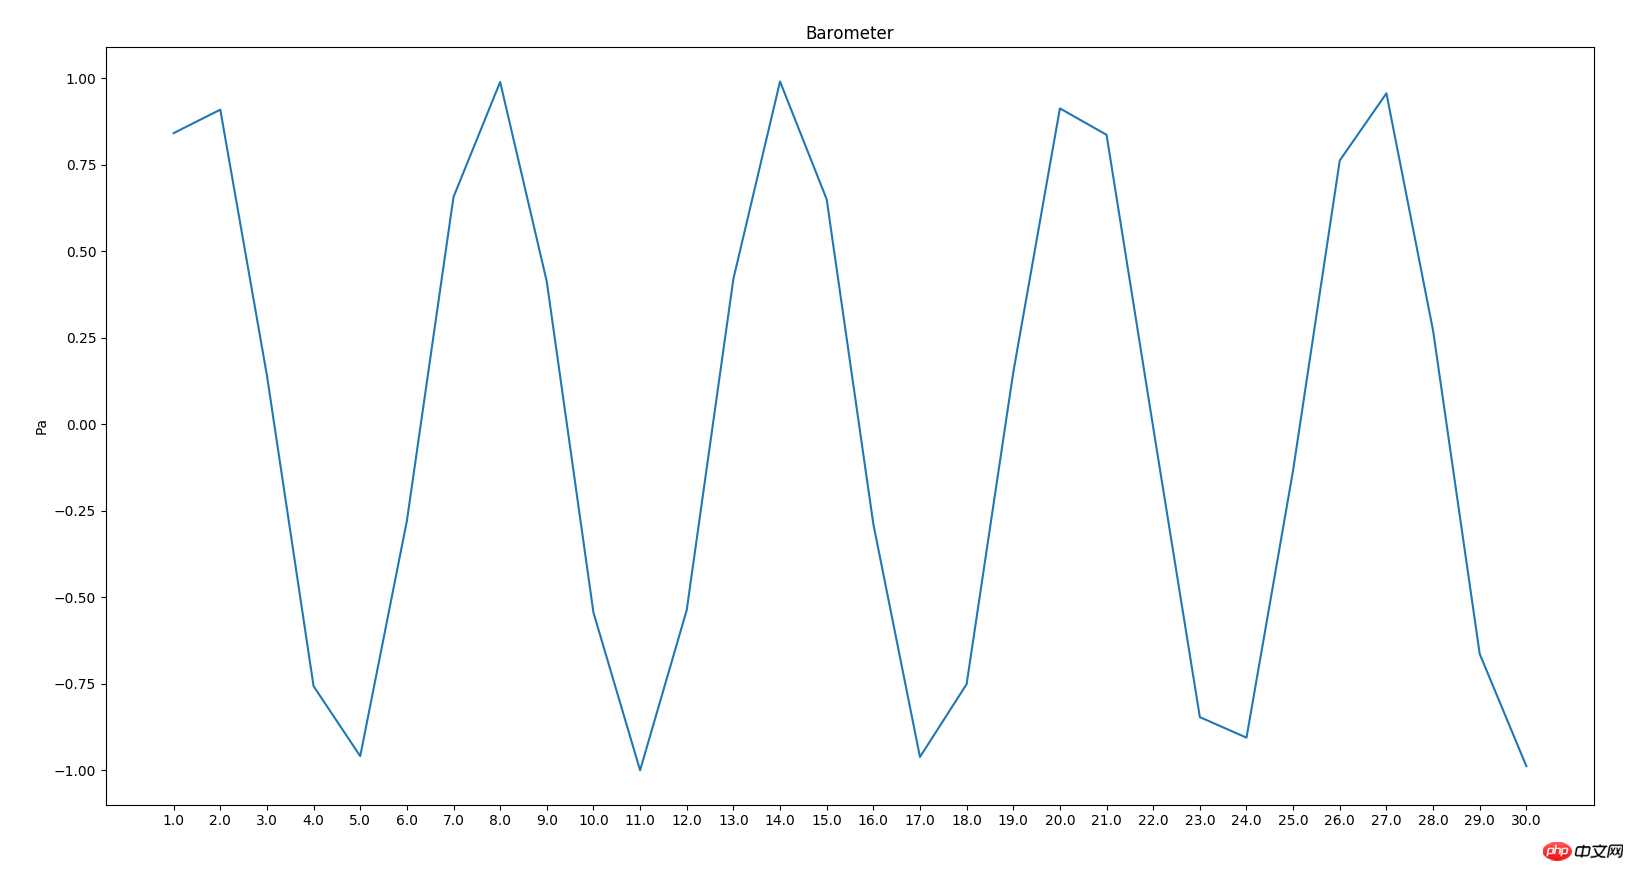
Reference:
Good place to learn python:
The above is the detailed content of Detailed explanation of examples of python reading excel data drawing. For more information, please follow other related articles on the PHP Chinese website!
 Compare the similarities and differences between two columns of data in excel
 excel duplicate item filter color
 How to copy an Excel table to make it the same size as the original
 Excel table slash divided into two
 Excel diagonal header is divided into two
 Absolute reference input method
 java export excel
 Excel input value is illegal


![[Web front-end] Node.js quick start](https://img.php.cn/upload/course/000/000/067/662b5d34ba7c0227.png)


