Home > Web Front-end > JS Tutorial > body text

Detailed examples of visual chart compilation and packaging using Webpack 2

零下一度
Release: 2017-06-25 09:30:59
Original
1788 people have browsed it

The statistical analysis of Webpack 2 compilation and packaging using visual charts is explained in detail for your more intuitive reference.

In the previously updated seventeen episodes of "Webpack 2 Video Tutorial", we have successively explained Webpack 2 from configuration to packaging, compression optimization to debugging status, etc. in detail. In this In this section, we use visual charts to gain a deeper understanding of the packaging and compilation process of Webpack 2. At the same time, visual charts are also a very intuitive solution for project overview and optimization guidance.

1. Webpack 2 compilation statistics generation

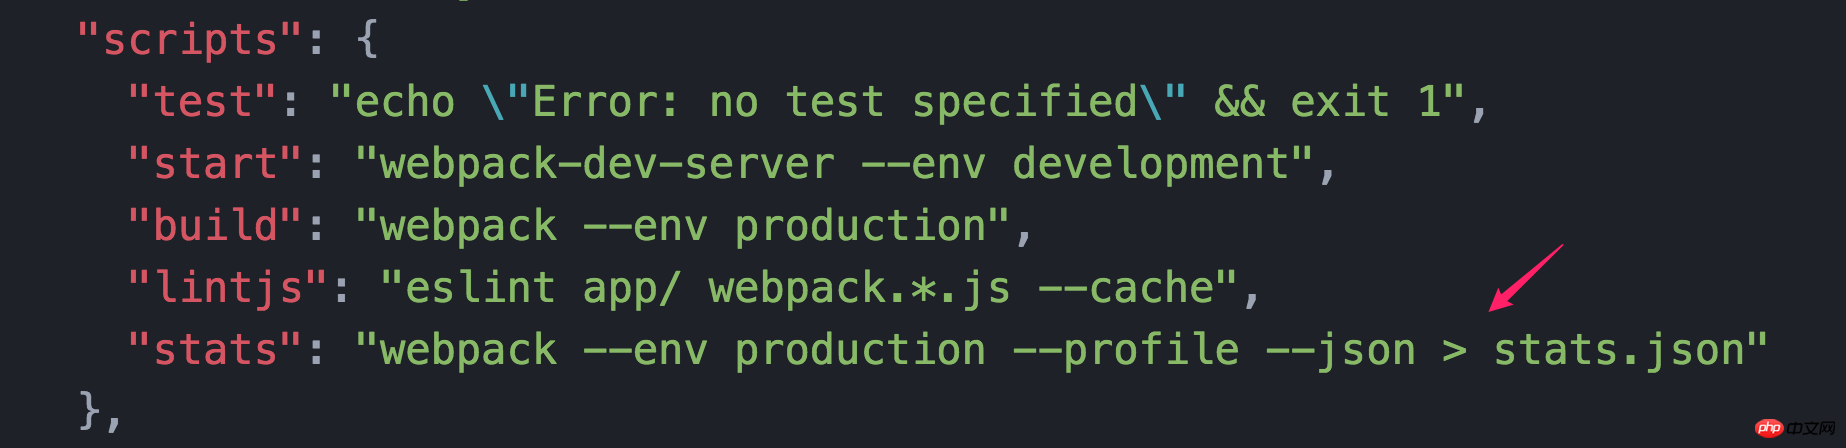
The parameters for Webpack 2 to generate statistics are mainly to configure the following two parameters.

  • --profile statistics generation to execution time related information, optional parameters;

  • --json allows Webpack to generate statistical information, output format for json.

The following is a screenshot of the configuration in the test project package.json.

Detailed examples of visual chart compilation and packaging using Webpack 2

After configuration, execute the command npm run stats on the command line to see the generated statistics file stats.json# in the project directory. ##.

2. Use the generated data to generate visual charts

2.1 Official visual analysis tool

The official provides a visualization tool, the address is http://webpack.github .io/analyse/, select the

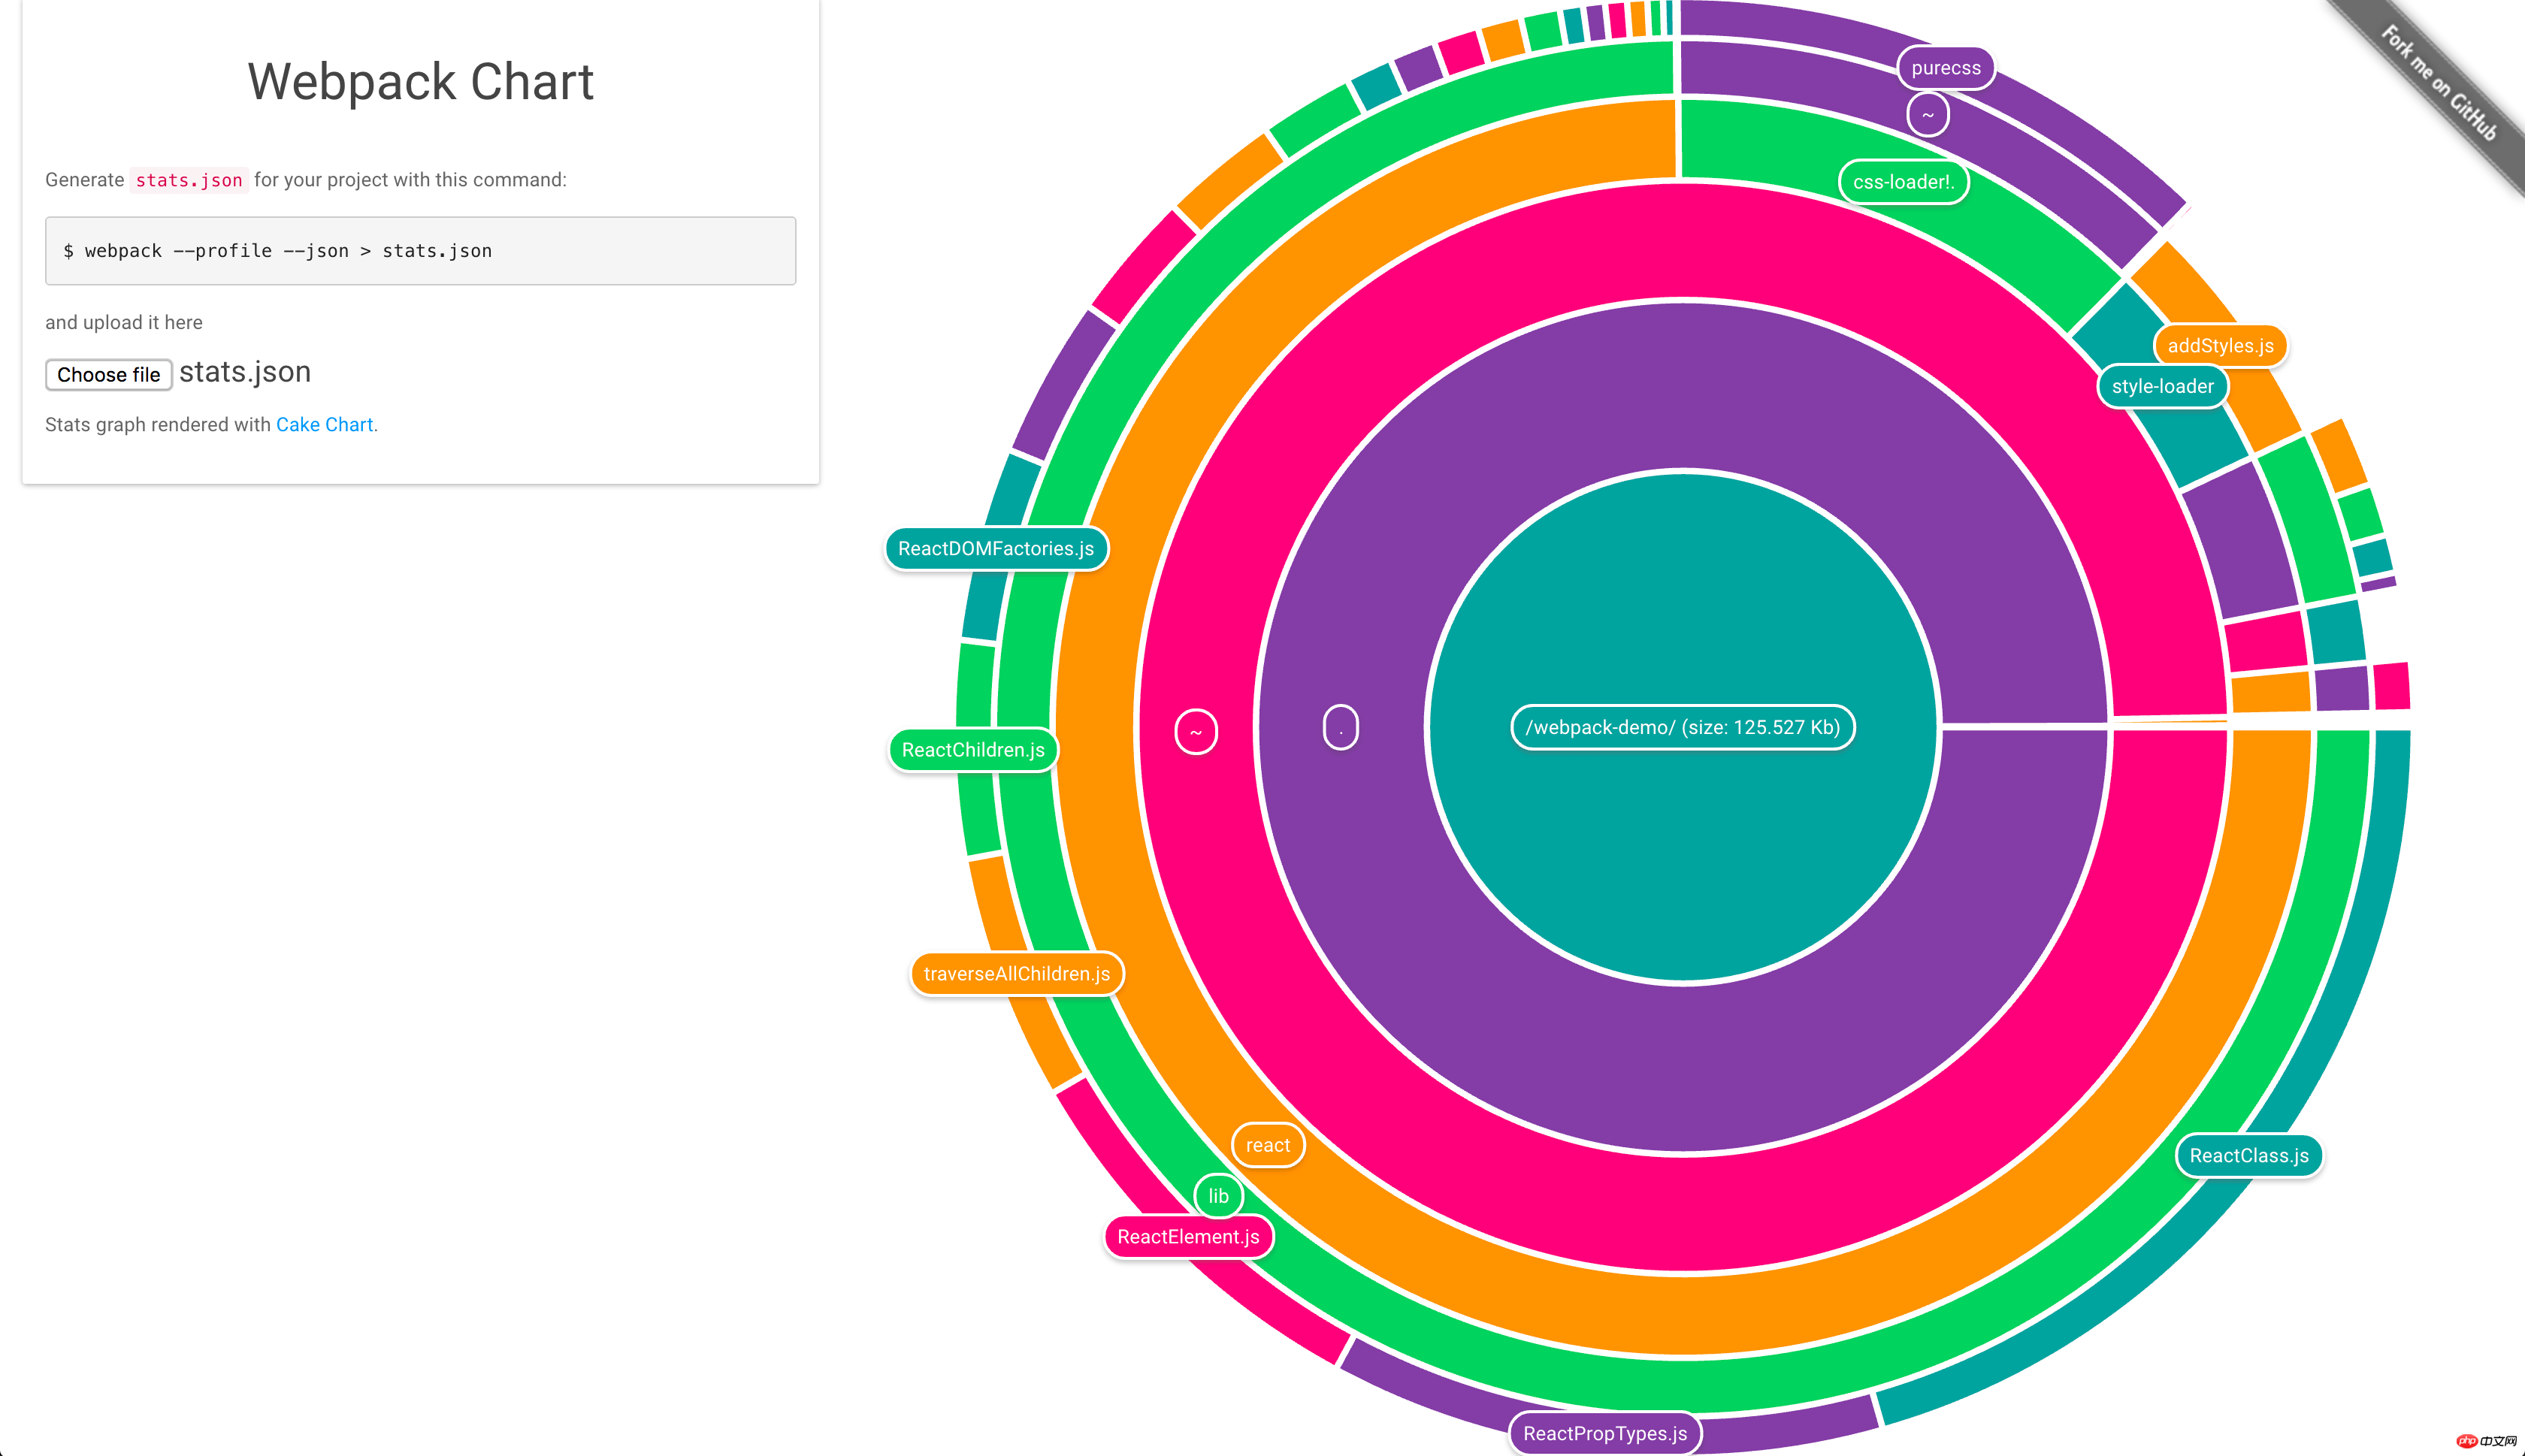
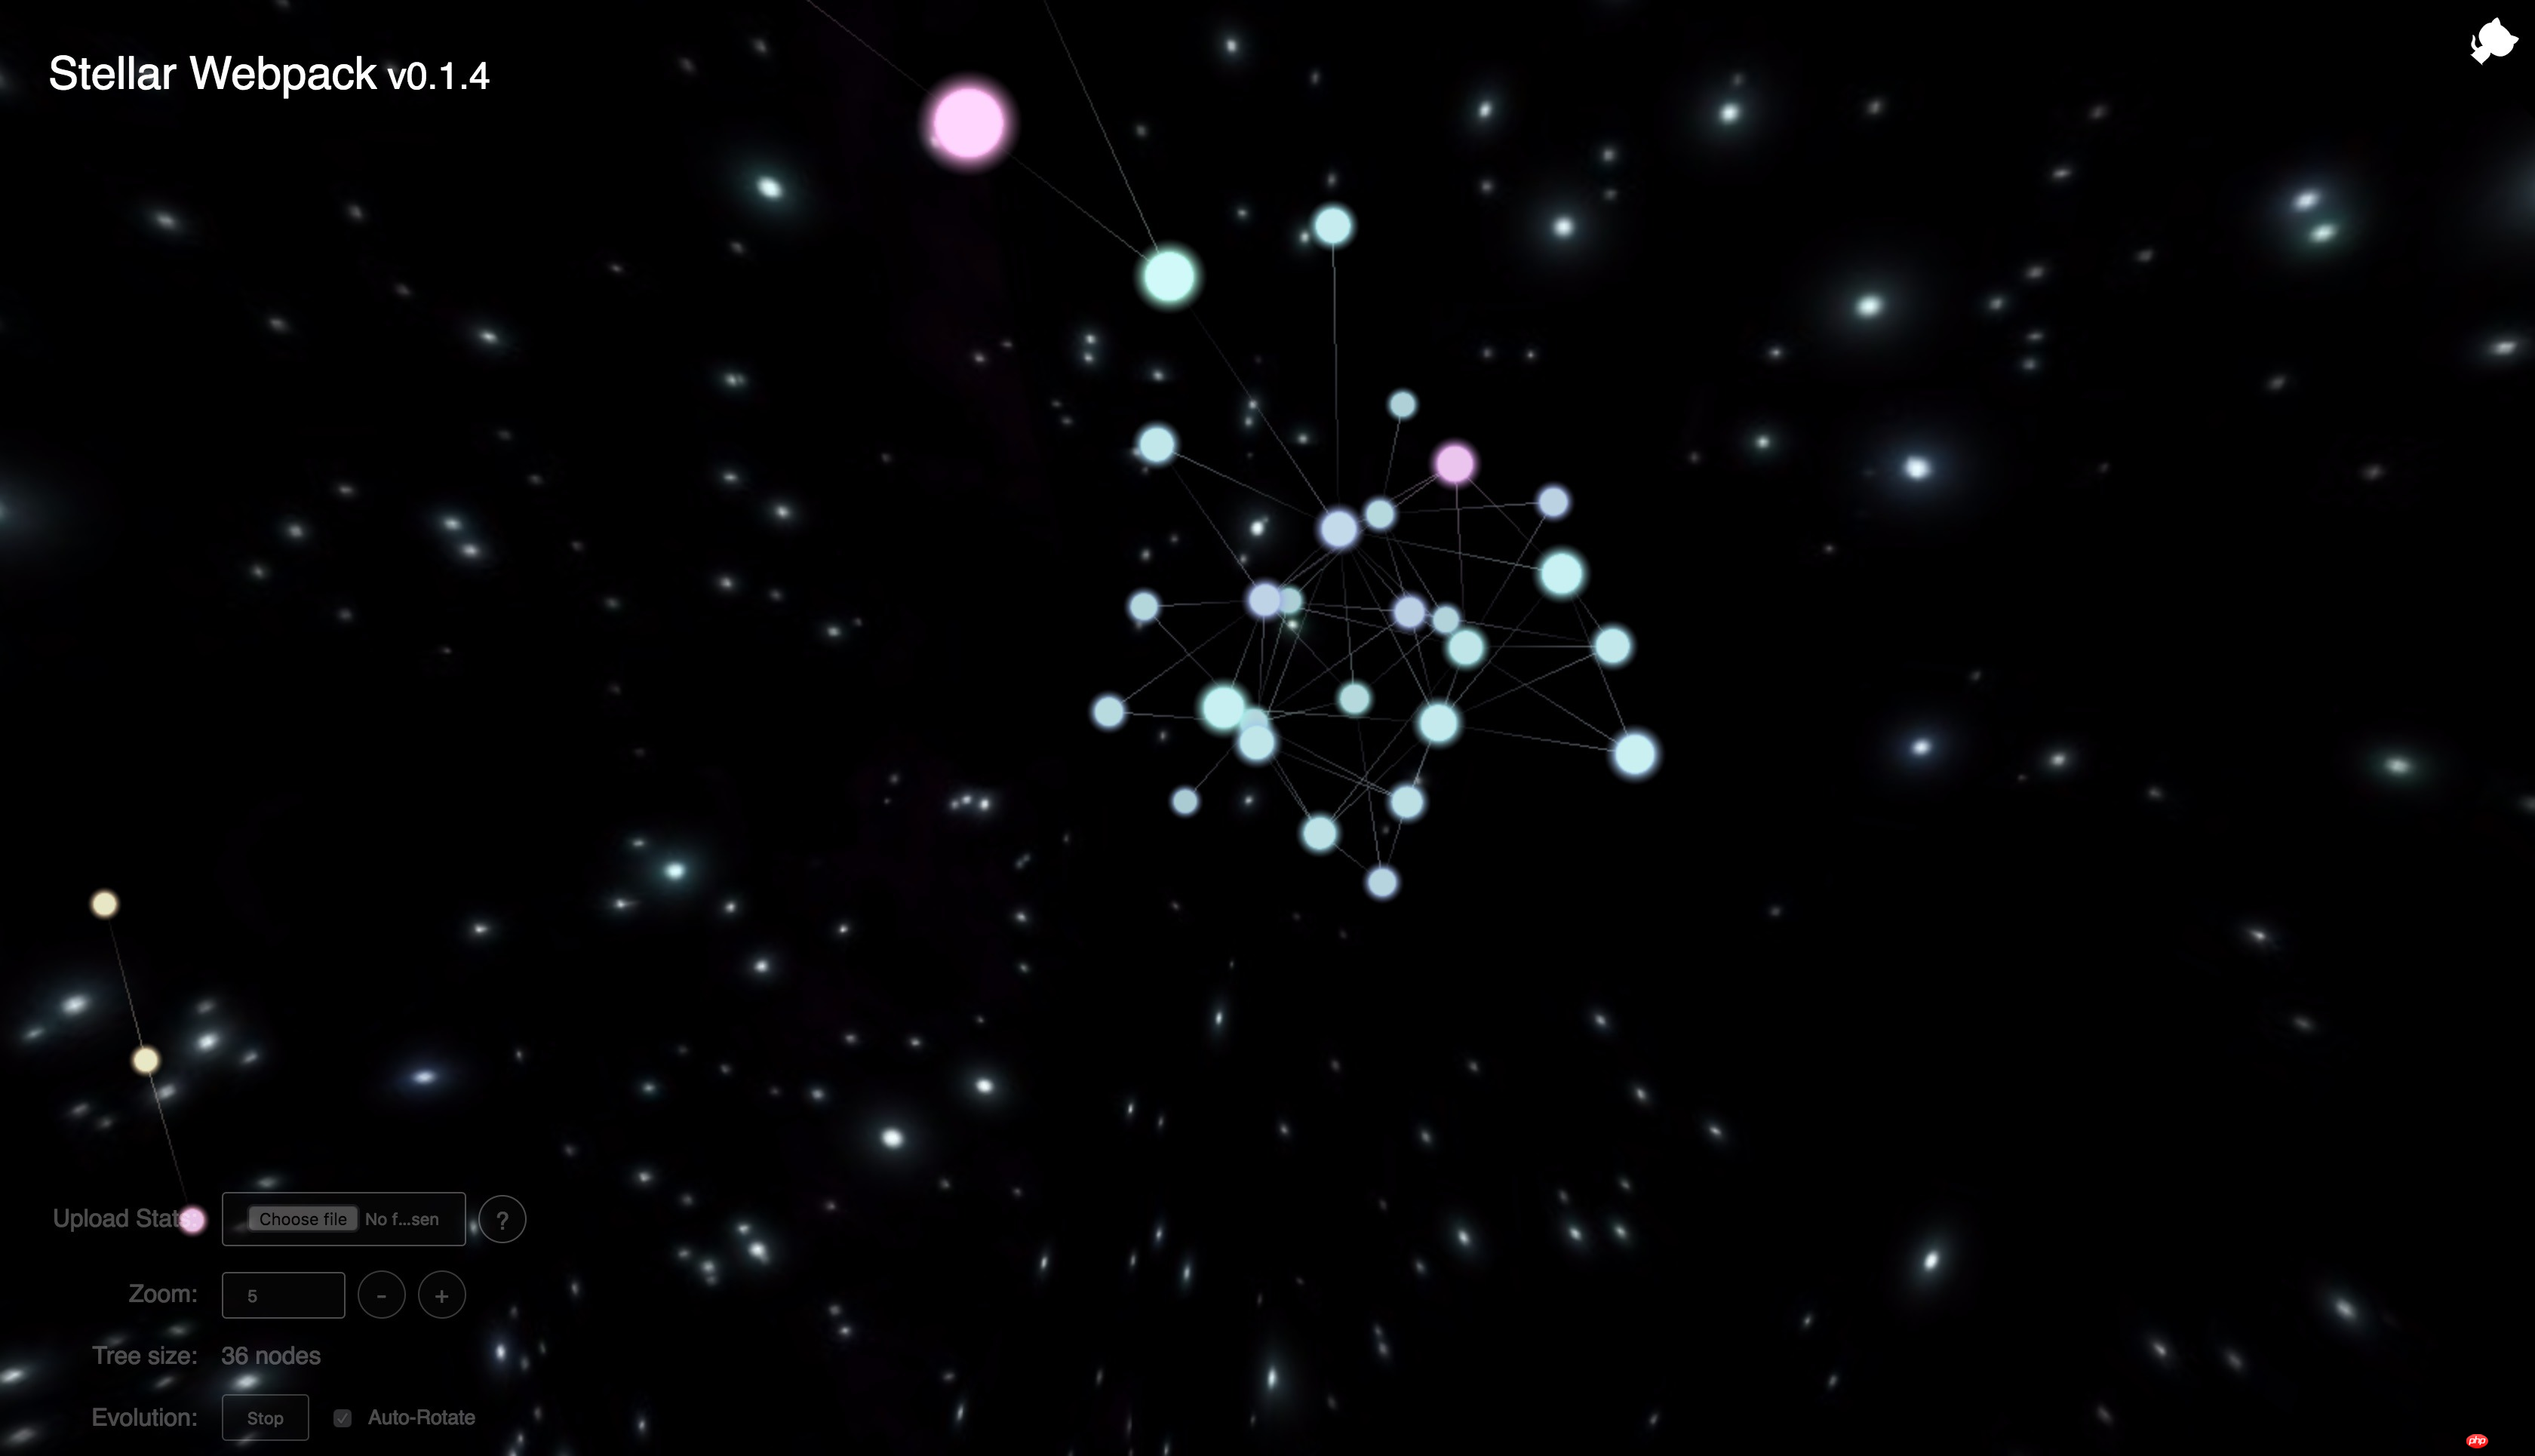
stats.json file generated above to generate a visual chart generated for the project.

Detailed examples of visual chart compilation and packaging using Webpack 2

In this chart you can see the size of your project’s generated files, reference relationships, and related information about the modules in the project.

2.2 Webpack Visualizer

is also a web generation tool. You can choose to upload the generated

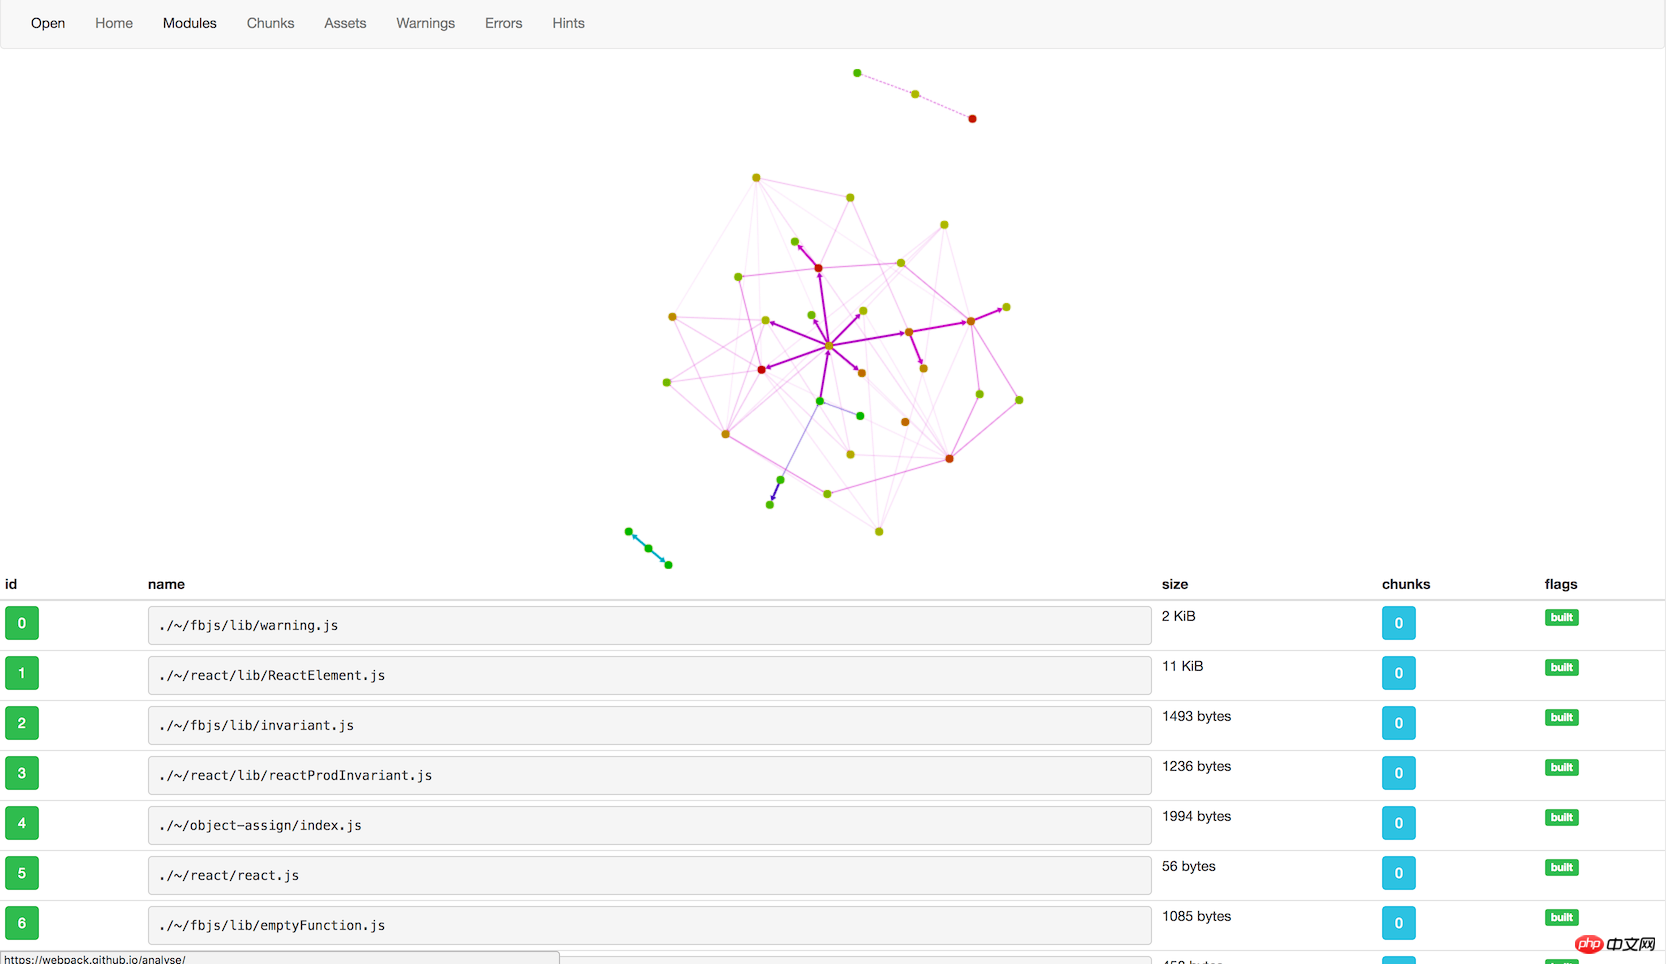
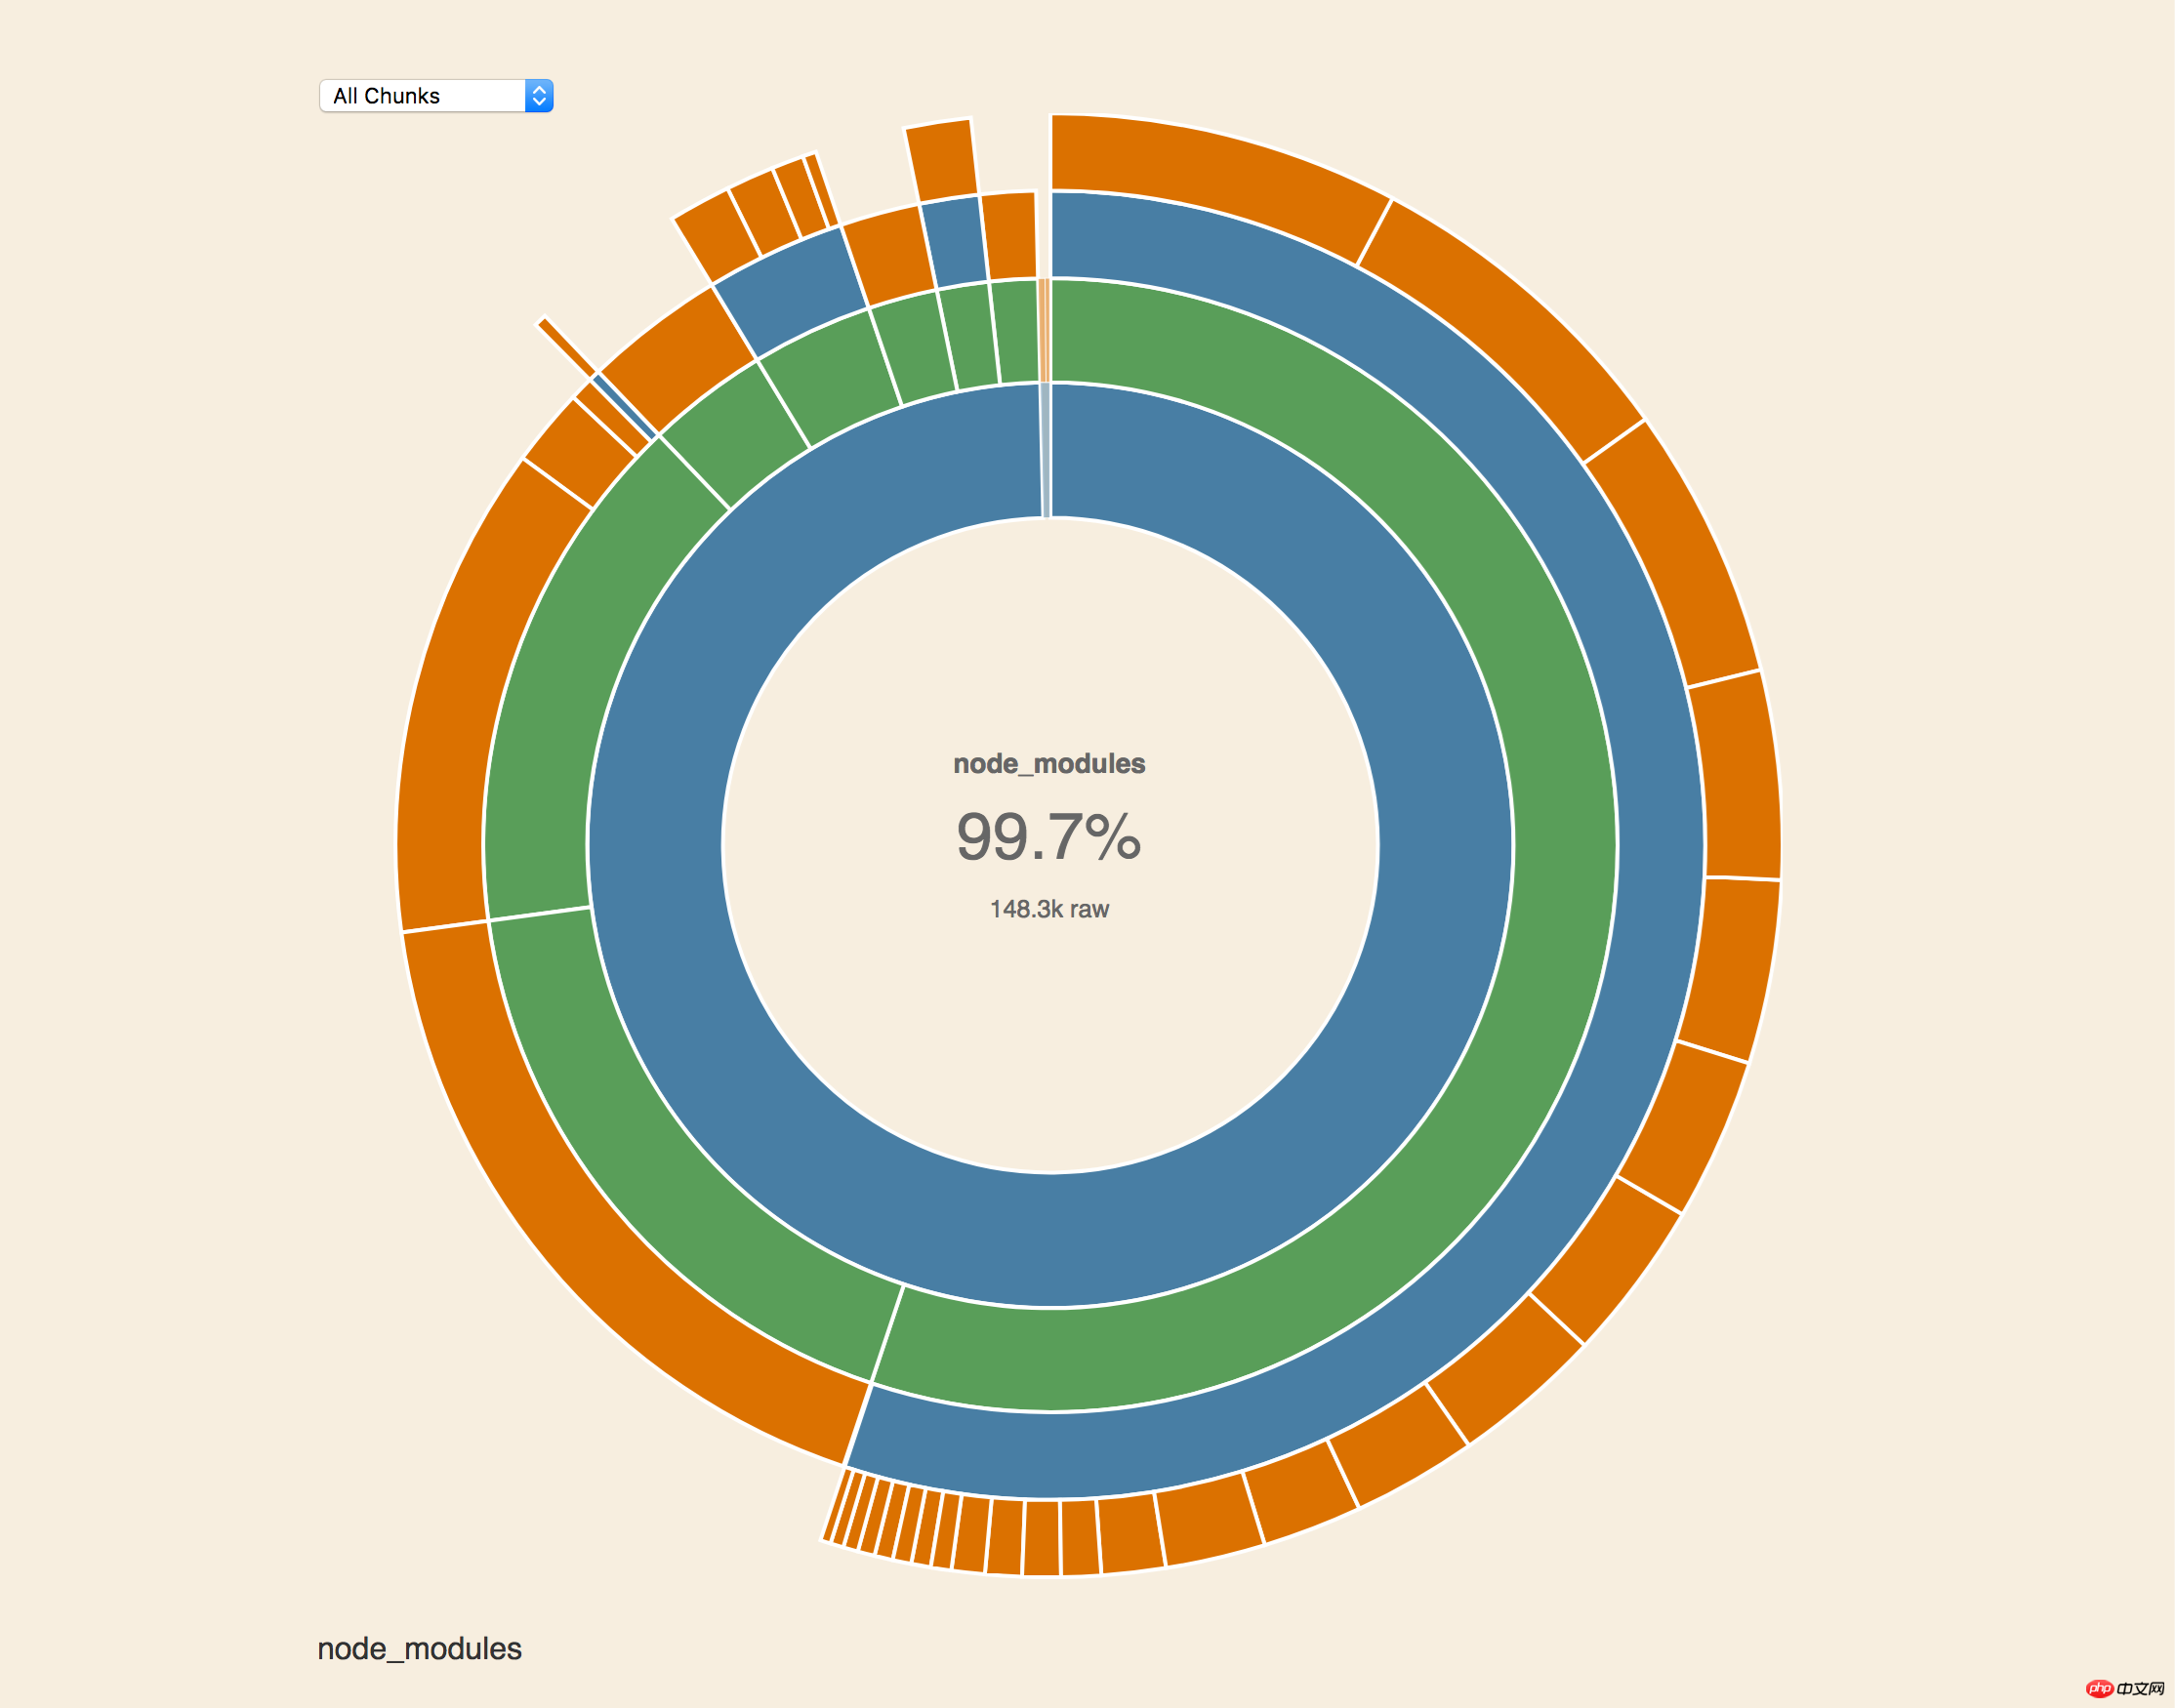
stats.json file to generate charts.

Detailed examples of visual chart compilation and packaging using Webpack 2

2.3 Duplicate package detection and charting

You can install the duplicate-package-checker-webpack-plugin plug-in to detect duplicate packages in the project. To facilitate reference optimization of the project.

Detailed examples of visual chart compilation and packaging using Webpack 2

Of course, you can directly use the previously generated data file to directly generate a more cool graphical statistical information.

https://alexkuz.github.io/webpack-chart/

Detailed examples of visual chart compilation and packaging using Webpack 2

2.4 Unused resource detection

Use can also detect those in the project The resource files are not used and are provided for reference in later optimization projects.

2.5 3D chart generation

There is also a tool that can generate 3D icons, but it seems that the information is too confusing, so it can be used as a toy.

https://alexkuz.github.io/stellar-webpack/

Detailed examples of visual chart compilation and packaging using Webpack 2

2.6 Some other tools

can install a component locally and generate The resource usage icon can be enlarged or reduced.


Detailed examples of visual chart compilation and packaging using Webpack 2

A visualization tool for generating package dependencies, which can be used to graphically view information such as circular dependencies between packages.

Detailed examples of visual chart compilation and packaging using Webpack 2

3. Summary

These visual tools can greatly improve the efficiency of finding optimization targets when optimizing projects later.

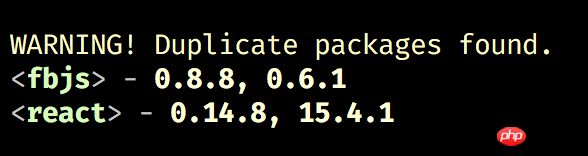
However, all performance issues and package dependency guidelines should always be implemented throughout the entire project development process, rather than expecting to optimize problems such as project dependency confusion at the end, so as not to get back to work.

Source code address in the course:

The above is the detailed content of Detailed examples of visual chart compilation and packaging using Webpack 2. For more information, please follow other related articles on the PHP Chinese website!

source:php.cn
Statement of this Website
The content of this article is voluntarily contributed by netizens, and the copyright belongs to the original author. This site does not assume corresponding legal responsibility. If you find any content suspected of plagiarism or infringement, please contact admin@php.cn
Popular Tutorials
More>
Latest Downloads
More>
Web Effects
Website Source Code
Website Materials
Front End Template
About us Disclaimer Sitemap
php.cn:Public welfare online PHP training,Help PHP learners grow quickly!