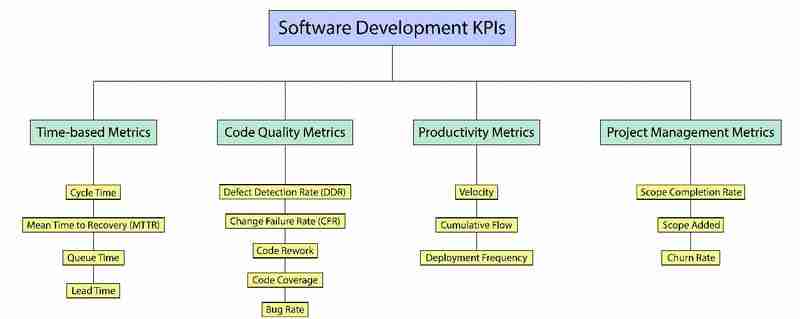
Managing a software development team is no mean feat. Till they take the project to the finish line, an engineering project manager can't take a breather. That is the reason software engineering managers look for ways to improve the performance of their projects as well as their teams. And, that's exactly where things like Kpi come in God's disguise.
KPIs are like your team's fitness tracker -- they help you see where things are working smoothly and where you might need to tighten the screws. But with a zillion KPIs out there, which ones should you actually care about? Let's break down the top 15 that will make you look like a rockstar software team manager and a few you might want to ditch.
KPIs are more than just numbers on a screen -- they're your roadmap to better decision-making. By tracking the right metrics, you can identify where your team is excelling and where there's room for improvement. It's like having a crystal ball that helps you predict project timelines, resource needs, and potential roadblocks.

Imagine you're in a race, but instead of cars zooming around a track, your team is racing to complete tasks in a sprint.
The question is: how fast can they get from the starting line ("to-do") to the finish line ("done")?
That's where Cycle Time comes in -- it's the stopwatch that tells you just how quick your team is at getting stuff done.

Cycle Time is all about speed, but it's not just about going fast for the sake of it.
It's about efficiency and knowing where the slowdowns happen. On average, high-performing teams have a Cycle Time of about 1.8 to 3.4 days per task.
If it's taking longer, it might be time to look under the hood and see what's causing the delay -- maybe it's a process bottleneck, too much multitasking, or just plain old technical debt.
Say your team is working on a new feature for a mobile app. The task moves from the backlog to "in progress" on Monday morning. Your dev team starts coding, testing, and pushing commits, and by Wednesday afternoon, the task is complete and marked "done." That's a Cycle Time of 3 days.
Now, let's say another task hits a snag -- maybe the code review takes forever, or there's a dependency that's holding things up. If that task drags on for 7 or 10 days, it's a sign that something's not quite right.
Here's where the magic happens: By tracking Cycle Time, you can spot patterns.

Maybe your team is super speedy on some tasks but bogged down on others. With this insight, you can dive into the specifics and figure out how to streamline the process. Maybe it's as simple as tweaking the code review process or prioritizing tasks differently.
The goal? To reduce Cycle Time, so your team is consistently knocking out tasks like pros.
And when that happens, you're not just moving fast -- you're moving smart.

When it comes to code, it's not about writing a ton of it -- it's about making sure what you do write actually works. That's where Code Coverage comes into play.
Think of Code Coverage as your code's health checkup.

It tells you how much of your codebase is being tested, so you know you're catching those sneaky bugs before they become a problem.
In the world of software development, a good benchmark for Code Coverage is around 70-80%. If you're hitting that, you're doing pretty well.
But remember perfection isn't the goal here -- 100% coverage is like trying to catch every grain of sand on a beach.

Instead, focus on making sure the critical parts of your code are covered.
Imagine you're building a new feature for an e-commerce site -- let's say it's a shopping cart.

You've written code that adds items to the cart, calculates totals, and processes payments. Now, you want to make sure all this works before customers start using it.
You write tests for each part:
Adding items to the cart -- You test to see if items are added correctly.
Calculating totals -- You check that the math is right when someone adds multiple items.
Processing payments -- You test the payment gateway to make sure transactions go through smoothly.
If your tests cover all these scenarios, and they run without errors, you've got solid Code Coverage. But if you skip testing the payment process (maybe because it's complex or takes extra time), you're leaving a critical part of your code untested -- which is like leaving your door unlocked at night.
By keeping an eye on Code Coverage, you ensure that most of your code is being tested, which reduces the chance of bugs sneaking into production. It's all about catching issues early, so they don't turn into customer complaints later on.

Picture this: your dev team keeps rewriting the same chunks of code over and over. Instead of sprinting toward progress, they're stuck on a hamster wheel, going in circles without actually moving forward. That's Code Rework in action, and it's a sign that something's off.
Ideally, your team should spend more time building new features and less time redoing what's already been done. Too much Code Rework can be a productivity killer.
In fact, studies show that frequent rework can consume up to 40% of a developer's time -- time that could be better spent on innovation.

Think of Change Failure Rate (CFR) as your dev team's "bug-o-meter." It measures how often your code changes end up breaking stuff. A high CFR is like having a leaky boat---you're constantly bailing water (fixing bugs) instead of sailing smoothly (building cool new features).
In an ideal world, every change you make to the codebase would work flawlessly. But in reality, things break. According to the Accelerate State of DevOps Report, the industry average for CFR is around 16-30%, meaning that out of every 10 changes, 1 to 3 might cause a hiccup. If your CFR is creeping above that, it's a sign that your code needs more TLC before hitting production.

Let's say your team rolls out a new feature, and immediately, users start reporting crashes. You dig into the data and realize that 40% of your recent deployments led to issues. Ouch! That high CFR means your team will be spending more time firefighting bugs and less time innovating.
The goal? Lower your CFR by improving testing and code reviews, so you can spend more time building the next big thing and less time fixing what's already been shipped.

Defect Detection Ratio (DDR) is like your bug-catching scorecard---it tells you how many bugs you catch before the code hits the wild versus how many slip through after launch. The higher your DDR, the better your testing game is. But if more bugs are sneaking past you and showing up in production, it's time to sharpen your testing tools.
A good DDR shows that your testing process is solid, typically aiming for 85% or more of bugs caught before release. If your DDR is low, it's like missing a bunch of red flags, only to find out later when users start complaining.
Imagine you release a new app update. During testing, you catch 8 bugs, but after the launch, users report another 5. That gives you a DDR of 8/13, or about 62%. Not great. It means your testing missed nearly 40% of the bugs, which is a clear sign it's time to beef up your pre-release checks.
To bump up your DDR, consider improving automated tests, getting more thorough code reviews, or even running more user acceptance tests before the big launch. The better your DDR, the happier your users---and fewer "uh-oh" moments post-launch!

Bug Rate measures how frequently those pesky bugs show up in your code. A high bug rate can be a big red flag, signaling that code is either being rushed out the door or written by someone still learning the ropes. Industry data suggests that experienced teams typically aim for fewer than 10 bugs per 1,000 lines of code.
Your team launches a new feature, and within hours, 15 bugs are reported. If you're regularly seeing this kind of thing, it's a sign that code reviews or testing need more attention---or that your devs might need more time to do it right.
MTTR is all about how quickly your team can get back on its feet after a system crash.

It's your disaster recovery stopwatch, showing how fast you can bounce back from a mess. Ideally, you want a low MTTR---think minutes, not hours.
Your website crashes at 2 PM, and your team has it back online by 2:15 PM. That's an MTTR of 15 minutes. If it usually takes your team an hour to recover, it might be time to refine your incident response plan.

Velocity measures how much work your team gets done during a sprint. It's your productivity gauge, but don't forget---it's not always apples to apples across different teams. What's important is tracking how your velocity changes over time, not just comparing numbers.
Last sprint, your team completed 50 story points. This sprint, they finished 55. A higher velocity could mean your team is getting into a groove---or it could mean they took on easier tasks. Keep an eye on consistency here.
Cumulative Flow shows you where tasks are piling up in your workflow.

Think of it as a traffic report for your project---if tasks are stuck in one stage too long, you've got a bottleneck.
You notice a bunch of tasks lingering in "code review" while others move smoothly. This might mean you need more reviewers or better-defined criteria to keep things moving.

Deployment Frequency tracks how often your team pushes code into production. More frequent deployments generally mean your team is agile and adaptable---just make sure you're not sacrificing quality for speed.
Your team deploys updates twice a week. That's good if those updates are solid, but if each deployment leads to bugs, it might be time to dial it back and focus on quality.

Queue Time measures how long tasks sit in a waiting state, like when they're stuck in the "to-do" pile. Long queue times could signal inefficiencies in your process, like too few team members handling too many tasks.
If tasks are sitting for days waiting for QA approval, it's a sign that either the QA team needs help, or the criteria for moving tasks forward need streamlining.

Scope Completion Rate tells you how much of the work your team planned to do actually gets done. If your team's regularly leaving tasks unfinished, it might mean they're biting off more than they can chew.
あなたのチームは、このスプリントで 20 のタスクを完了する予定でしたが、完了したのは 15 個だけでした。このようにスコープ完了率が低い場合は、チームがより現実的な目標を設定するか、より適切に時間を管理する必要があることを示している可能性があります。

追加されたスコープは、スプリントの開始後に新しいタスクが追加される頻度を追跡します。ここでの割合が高い場合は、計画が不十分であること、またはさらに悪いことに、スケジュールやリソースを調整せずにプロジェクトの目標が拡大し続ける場合、範囲のクリープの兆候である可能性があります。
10 個のタスクからスプリントを開始すると、最後にはさらに 5 個のタスクが追加されます。これは範囲が 50% 増加することになります。これは、チームが計画中に作業の範囲を十分に徹底的に調べていないことを意味している可能性があります。

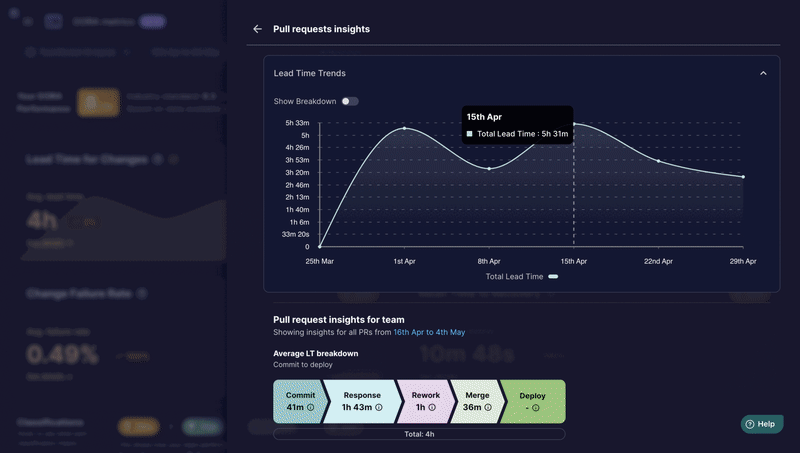
リードタイムは、タスクが作成されてから完了するまでの合計時間を測定します。それはアイデアから実行までの完全な旅のようなものです。通常、リードタイムが短いことはチームが効率的であることを意味しますが、リードタイムが長いことはプロセスの遅延またはボトルネックを示している可能性があります。
機能リクエストが届き、コンセプトから展開までに 2 週間かかります。同様のタスクに 1 週間かかった場合は、承認の遅れやチーム間での引き継ぎが多すぎることが原因で、何が遅くなっているかを調査する時期が来ました。
こちらもお読みください: 変更のリードタイム: DORA メトリクスの詳細とソフトウェア配信への影響

チャーンレートは、コードが書き直された頻度、または書かれた直後に大幅に変更された頻度を追跡します。高いチャーンは、最初のアプローチが完全に正しくなかったか、要件が大きく変化していることを示している可能性があります。
あなたのチームは機能を作成しましたが、最初の実装がニーズを満たしていなかったため、1 週間以内にその半分を書き直す必要がありました。これが繰り返される場合は、計画にもっと時間を費やす必要があるか、最初から要件を明確にする必要があることを示しています。

どの KPI が注目に値するか知りたいですか?チームのパフォーマンスと進捗状況の全体像を把握できるものに焦点を当ててください。以下に注目してください:
コーディング効率: 「これを書いた!」というところから、コードがどのくらい速く、スムーズに流れるか。 「わぁ、うまくいく!」
コラボレーション指標: よくリハーサルを行ったバンドやシンクロナイズド スイミング チームなど、チームがどれだけうまく同期して演奏しているか。
予測可能性の指標: プロジェクトの結果をどの程度正確に予測できるか。天気予報アプリと同じくらい信頼性の高い予測が可能になります (ただし、より正確です!)。
信頼性指標: コードがどの程度堅牢であるか、およびテストが重大な問題になる前にそれらの卑劣なバグをどの程度うまく検出できるか。
これらの KPI は、予期せぬ事態を回避し、プロジェクトを順調に進めるのに役立ちます。これらは成功ツールキットの必需品であると考えてください。飾り気のない、良いものだけです。
それでは、要点を以下に示します。KPI は単なる数値ではなく、賢明な意思決定のための秘密兵器です。これは、エンジニアリングの生産性の紆余曲折をプロのように乗り越えるのに役立ちます。さらに、Middleware の DORA メトリクスをミックスに追加すると、無敵のチームが完成します。ミドルウェアは、導入頻度、リードタイム、変更失敗率、平均復旧時間などの DORA 指標を簡単に追跡することで、推測を排除します。
KPI を常に監視し、常に正しい軌道に乗っていることを確認してくれる個人的な相棒がいるようなものです。ミドルウェアを使用すると、問題に対応するだけでなく、問題を予測してソフトウェア開発を成功に導くことができます。私たちのオープンソース リポジトリをチェックしてください!
 ミドルウェア本社 / ミドルウェア
開発者の可能性を引き出すオープンソースのエンジニアリング管理


オープンソース コミュニティに参加してください

ミドルウェアは、エンジニアリング リーダーが DORA メトリクスを使用してチームの有効性を測定および分析できるように設計されたオープンソース ツールです。 DORA メトリクスは、ソフトウェア配信のパフォーマンスと運用効率に関する洞察を提供する 4 つの主要な値のセットです。
それらは次のとおりです:
目次
ソフトウェア開発 KPI (主要業績評価指標) は、コード品質、デプロイ頻度、リードタイムなどの指標を含む、開発プロセスの有効性と効率を評価するために使用される測定可能な値です。 KPI は、特定の目標に向けた進捗状況を評価し、全体的なパフォーマンスを向上させるのに役立ちます。
DORA メトリクスを含む KPI を追跡するには、包括的なパフォーマンス追跡にはミドルウェアを使用し、プロジェクト管理には Jira、コードの分析情報には GitHub を使用します。
The above is the detailed content of Top Software Development KPIs You should track in 5. For more information, please follow other related articles on the PHP Chinese website!


