Bitcoin (BTC) price has been showing a willingness to drop lower. However, market fundamentals point to something different. BTC is down by nearly 10% in the past week

Bitcoin (BTC) price has shown a willingness to drop lower on the technicals. However, on-chain market fundamentals point toward something different.
BTC is down by nearly 10% in the past week, currently struggling to remain above $58,000. While the price has dropped significantly from the all-time high of $68,000, market fundamentals appear to be pointing toward an accumulation phase.
Technical Analysis
The Daily Chart
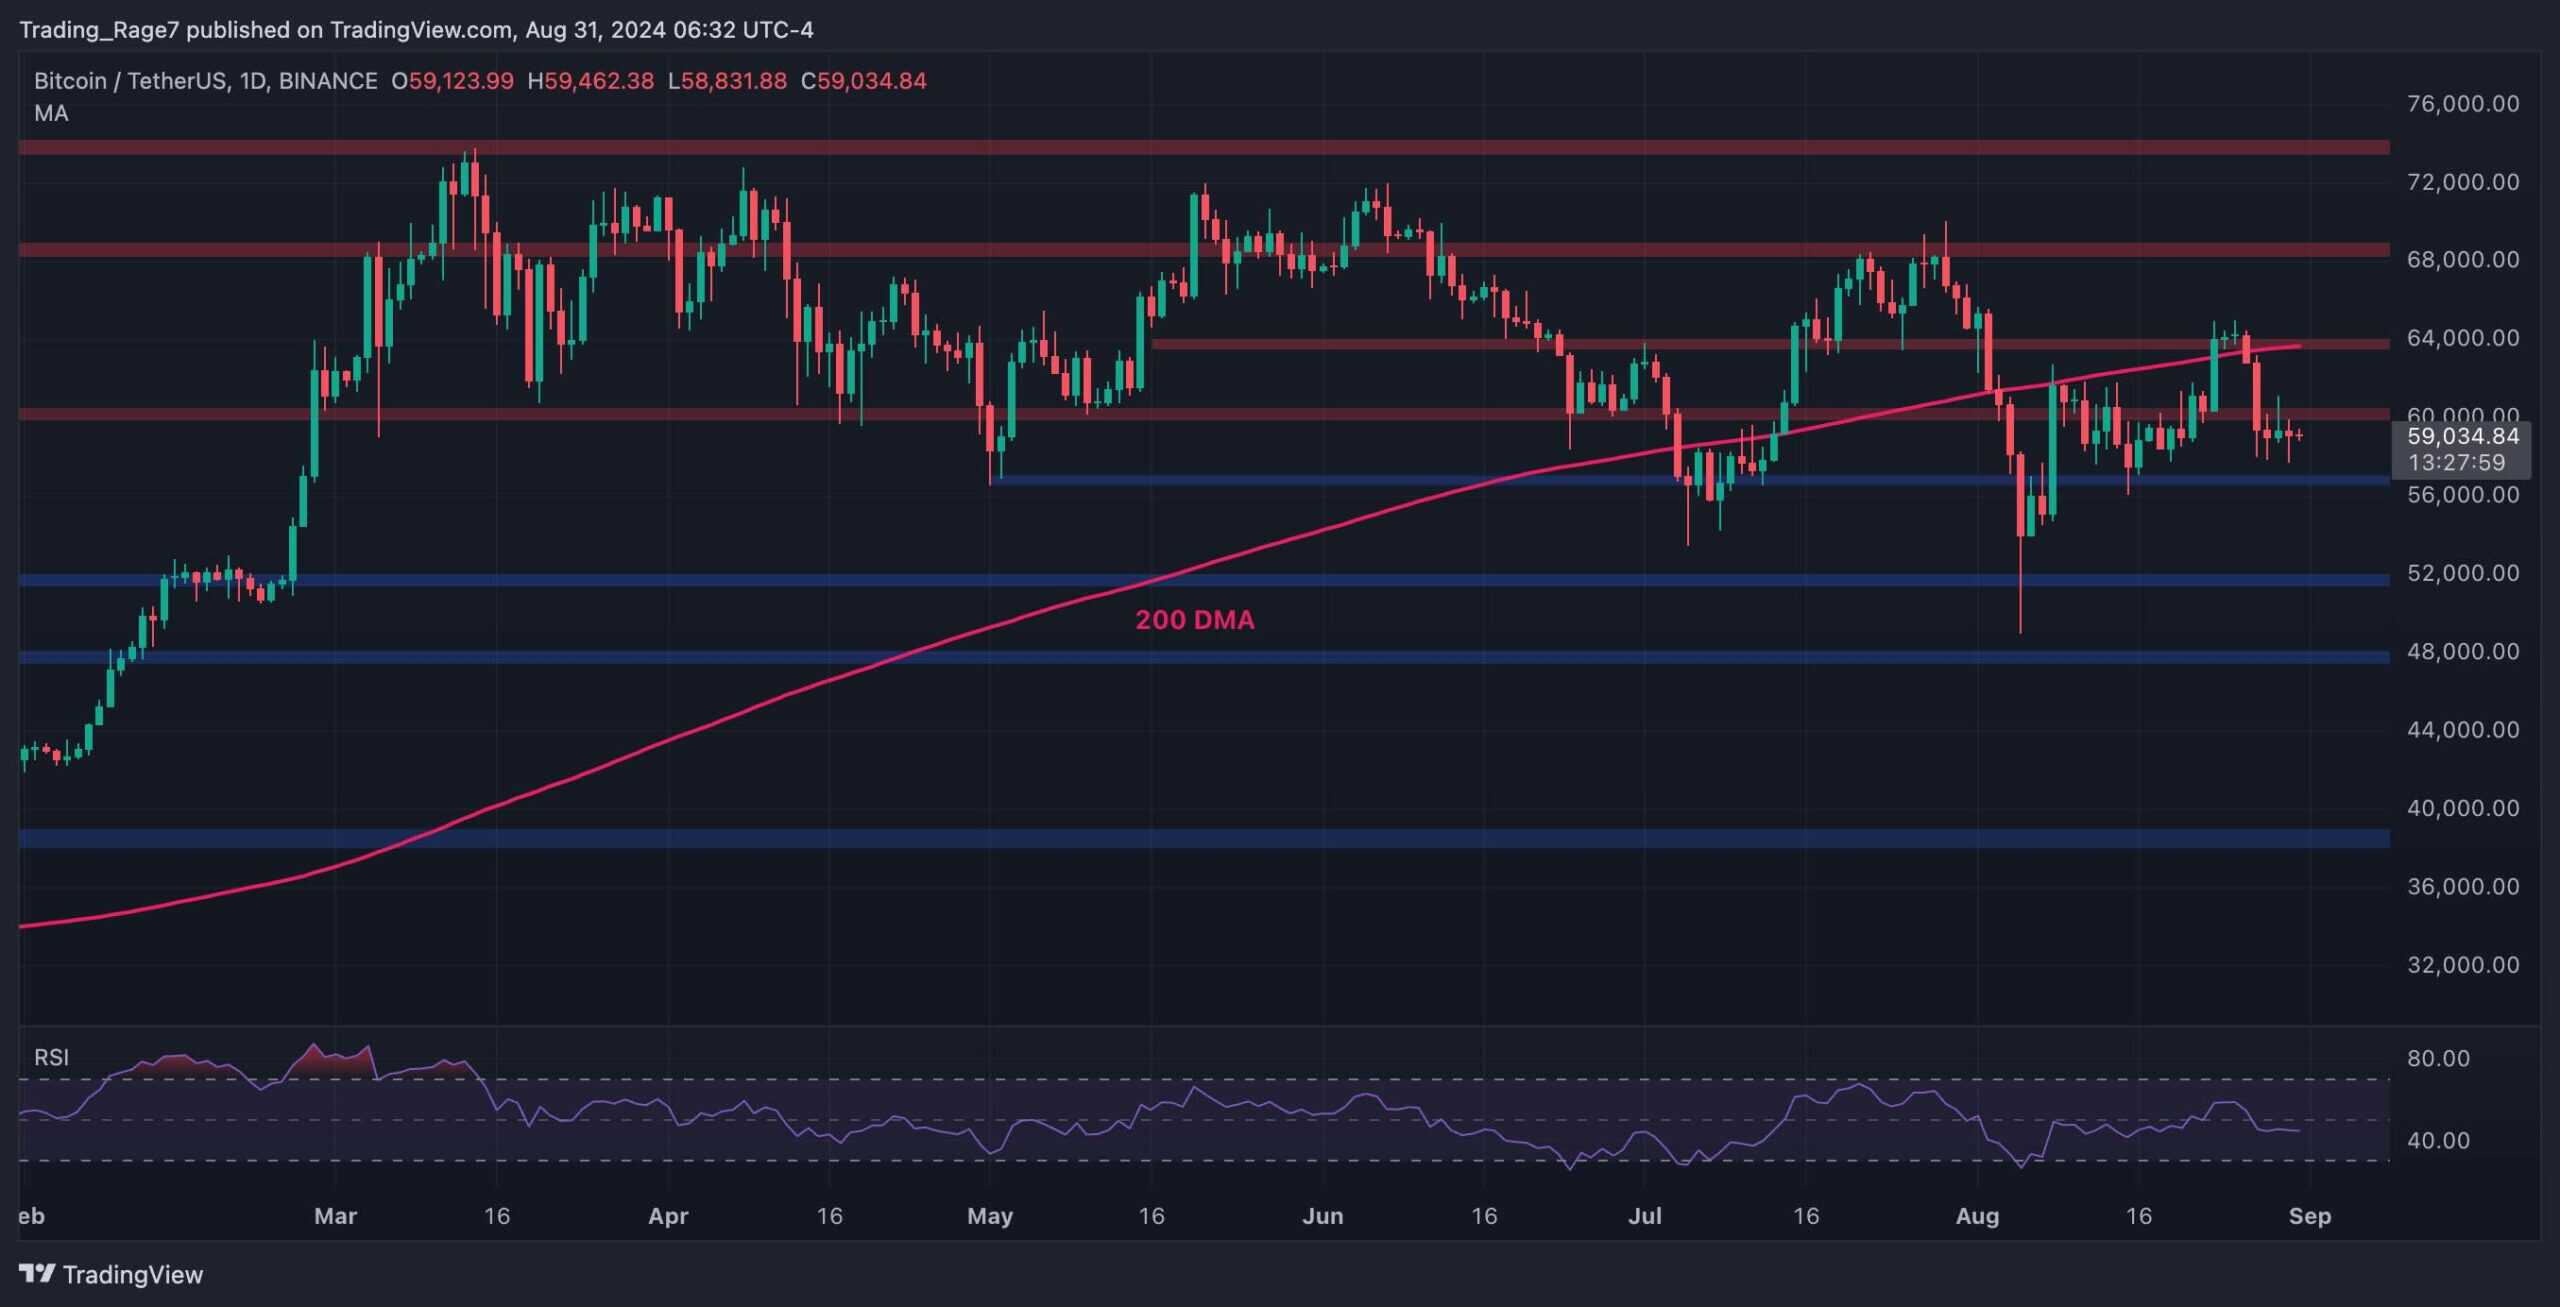
On the daily chart, the asset has been consolidating around the $60K level, following a rejection from the $64K resistance and the key 200-day moving average, which is situated around the same price mark. The market is currently likely to test the $56K support level.
The RSI indicator has also dropped below the 50% level, indicating a slight bearishness in momentum. Therefore, if the $56K level is unable to hold the price, a further decline toward the $52K support zone would be expected.
The 4-Hour Chart
Looking at the 4-hour chart, it is evident that the market has failed to rise back to the $68K resistance level, which it dropped from initially, as the $64K resistance zone has rejected the price to the downside. As things currently stand, a retest of the $56K level seems highly probable.
However, the cryptocurrency might be able to rebound from the level, as the market structure is showing signs of weakness in the bearish trend.
On-Chain Analysis
Bitcoin Exchange Reserve
While bitcoin’s price has been going through a lengthy consolidation period over the past few months, investors are wondering whether the market is experiencing an accumulation or a distribution period.
This chart demonstrates the Bitcoin Exchange Reserve metric, which measures the amount of BTC held on exchange wallets. As these coins can be sold quickly, they are assumed to be a proxy for supply.
As the chart suggests, the Exchange Reserve metric has been trending down rapidly since the beginning of the consolidation, indicating that an accumulation phase is happening.
As Bitcoin reserves continue to decline significantly, the chances for a supply shrink, which can lead to a new price rally, are increasing significantly. However, the futures market conditions also play a massive role in price action, and should be considered carefully before drawing any conclusions.
The above is the detailed content of Bitcoin (BTC) Price Analysis: BTC Shows Signs of Weakness, But Accumulation Phase Hints at a Bullish Rally. For more information, please follow other related articles on the PHP Chinese website!


