在计算机视觉和图像处理中,图像操作起着至关重要的作用。这些操作对于预处理、提升图像质量和启用高级算法等任务至关重要。在计算机视觉领域,调整大小、裁剪、调整亮度/对比度/伽玛和几何变换等操作是基础操作。它们能够进行高效计算、提取感兴趣区域、规范化图像强度和几何校准。在图像处理方面,这些操作对于降低采样率、裁剪无关区域、提升可见性和质量以及执行几何操作也至关重要

在各种场景中,调整图像大小是常见的,可以实现不同的目的,例如将图像适应特定尺寸或减小文件大小。图像插值和重采样是图像处理和计算机视觉中用于调整图像大小或比例的技术。
图像插值是指根据已知像素值,在图像中未知位置上估算像素值的过程。不同的插值方法使用不同的方式来估算未知像素的值
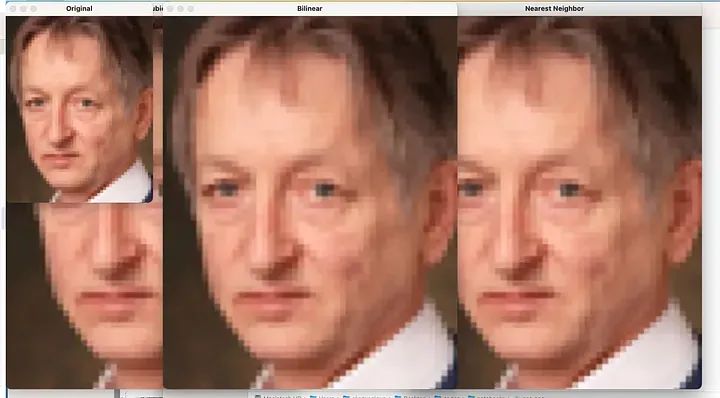
进行重写如下: 最近邻插值是一种将未知像素位置的值分配为最近已知像素值的方法。虽然这种方法简单,但可能会导致出现块状伪影和丢失细节的问题
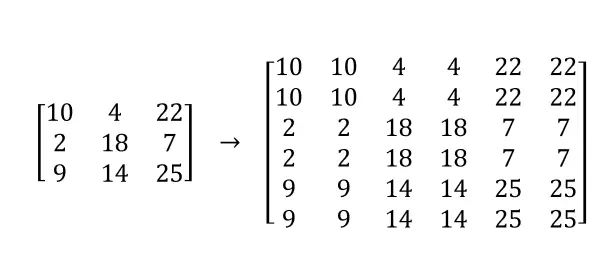
最近邻插值
双线性插值算法会考虑到四个最近的已知像素值,并通过加权平均来估算未知像素的值。与最近邻插值相比,双线性插值能够产生更加平滑的结果,但仍然可能引入一些模糊效果
双三次插值通过考虑更多的相邻像素并使用三次多项式来估算像素值,扩展了双线性插值。这种方法可以提供更高质量的结果,具有更平滑的过渡和更好的保留图像细节。
import cv2import numpy as npdef resize_image(image, scale, interpolation):width = int(image.shape[1] * scale)height = int(image.shape[0] * scale)resized_image = cv2.resize(image, (width, height), interpolation=interpolation)return resized_imageSCALE = 4# Load the imageimage_path = "image.png"image = cv2.imread(image_path)# Resize the image using nearest neighbor interpolationnearest_neighbor_resized = resize_image(image, scale=SCALE, interpolation=cv2.INTER_NEAREST)# Resize the image using bilinear interpolationbilinear_resized = resize_image(image, scale=SCALE, interpolation=cv2.INTER_LINEAR)# Resize the image using bicubic interpolationbicubic_resized = resize_image(image, scale=SCALE, interpolation=cv2.INTER_CUBIC)
裁剪图像的目的是去除不需要的内容或聚焦于特定的感兴趣区域。裁剪使您能够优化构图,消除干扰,并突出图像中的重要元素。去除不必要或无关的部分可以创造出视觉上吸引人且具有影响力的图像,有效地传达预期的信息或主题。
可以使用不同的方法来确定裁剪区域:
import cv2def crop_image(image, x, y, width, height):cropped_image = image[y:y+height, x:x+width]return cropped_image# Example usageimage = cv2.imread("cath.jpeg")cropped_image = crop_image(image, x=400, y=500, width=300, height=200)cv2.imshow("Cropped Image", cropped_image)cv2.waitKey(0)cv2.destroyAllWindows()亮度和对比度:
调整亮度和对比度对于增强图像的可见性和提高视觉吸引力至关重要。调整亮度可以使图像看起来更明亮或更暗,突显曝光不足或曝光过度的区域的细节。对比度调整增强了光亮和阴暗区域之间的区别,使图像显得更清晰和更动态。
通过调节亮度和对比度,您可以提升图像的整体质量和可读性,确保重要的特征能够清晰可见
import cv2import numpy as npimage_path = "cath.jpeg"def adjust_brightness(image, value):# Convert the image to the HSV color spacehsv = cv2.cvtColor(image, cv2.COLOR_BGR2HSV)# Split the channelsh, s, v = cv2.split(hsv)# Apply the brightness adjustmentv = cv2.add(v, value)# Clamp the values to the valid range of 0-255v = np.clip(v, 0, 255)# Merge the channels back togetherhsv = cv2.merge((h, s, v))# Convert the image back to the BGR color spaceadjusted_image = cv2.cvtColor(hsv, cv2.COLOR_HSV2BGR)return adjusted_imagedef adjust_contrast(image, value):# Convert the image to the LAB color spacelab = cv2.cvtColor(image, cv2.COLOR_BGR2LAB)# Split the channelsl, a, b = cv2.split(lab)# Apply the contrast adjustmentl = cv2.multiply(l, value)# Clamp the values to the valid range of 0-255l = np.clip(l, 0, 255)# Merge the channels back togetherlab = cv2.merge((l, a, b))# Convert the image back to the BGR color spaceadjusted_image = cv2.cvtColor(lab, cv2.COLOR_LAB2BGR)return adjusted_image# Load the imageimage = cv2.imread(image_path)# Adjust the brightnessbrightness_adjusted = adjust_brightness(image, value=50)# Adjust the contrastcontrast_adjusted = adjust_contrast(image, value=2)# Display the original and adjusted imagescv2.imshow("Original", image)cv2.imshow("Brightness Adjusted", brightness_adjusted)cv2.imshow("Contrast Adjusted", contrast_adjusted)cv2.waitKey(0)cv2.destroyAllWindows()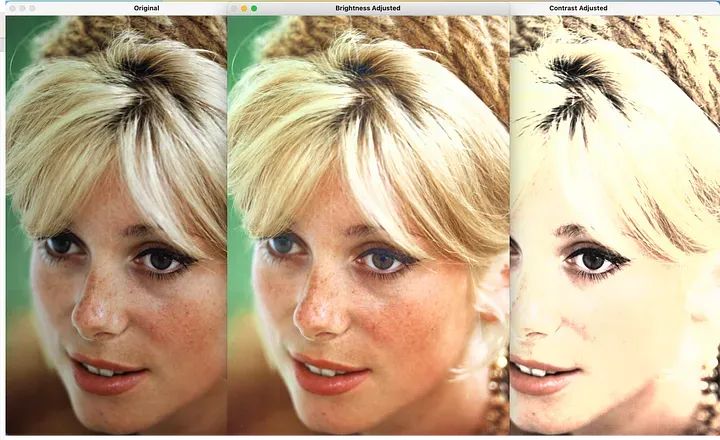
直方图是一种用于展示数据分布情况的图表。它将数据分成若干个区间,并统计每个区间内的数据数量,然后通过绘制垂直条形来表示各个区间的数据数量。直方图可以帮助我们直观地了解数据的分布特征,例如数据的集中程度、偏态以及异常值的存在等。通过观察直方图,我们可以更好地理解和分析数据,从而做出更准确的决策和预测。在统计学、市场研究、金融分析等领域,直方图被广泛应用于数据分析和可视化均衡化是一项用于增强对比度的技术。它通过重新分配像素强度值来覆盖更广范围的值,以实现此目的。其主要目标是通过图像获得更均匀分布的像素强度
通过重新分配像素强度,直方图是一种用于展示数据分布情况的图表。它将数据分成若干个区间,并统计每个区间内的数据数量,然后通过绘制垂直条形来表示各个区间的数据数量。直方图可以帮助我们直观地了解数据的分布特征,例如数据的集中程度、偏态以及异常值的存在等。通过观察直方图,我们可以更好地理解和分析数据,从而做出更准确的决策和预测。在统计学、市场研究、金融分析等领域,直方图被广泛应用于数据分析和可视化均衡化增强了图像的对比度。
import cv2import matplotlib.pyplot as pltimage_path = "cath.jpeg"image = cv2.imread(image_path, cv2.IMREAD_GRAYSCALE)# Apply histogram equalizationequalized_image = cv2.equalizeHist(image)# Calculate histogramshist_original = cv2.calcHist([image], [0], None, [256], [0, 256])hist_equalized = cv2.calcHist([equalized_image], [0], None, [256], [0, 256])# Plot the histogramsplt.figure(figsize=(10, 5))plt.subplot(1, 2, 1)plt.plot(hist_original, color='b')plt.title("Original Image Histogram")plt.xlabel("Pixel Intensity")plt.ylabel("Frequency")plt.subplot(1, 2, 2)plt.plot(hist_equalized, color='r')plt.title("Equalized Image Histogram")plt.xlabel("Pixel Intensity")plt.ylabel("Frequency")plt.tight_layout()plt.show()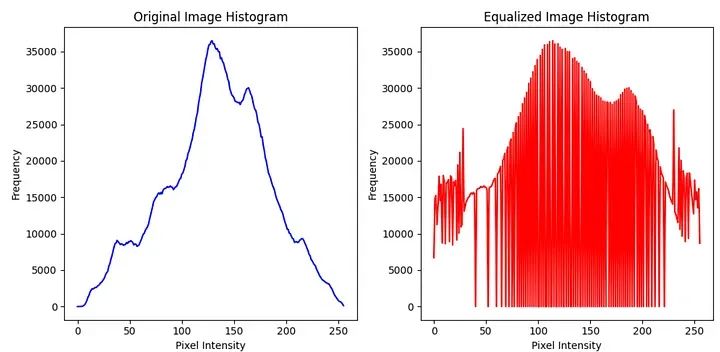
直方图是一种用于展示数据分布情况的图表。它将数据分成若干个区间,并统计每个区间内的数据数量,然后通过绘制垂直条形来表示各个区间的数据数量。直方图可以帮助我们直观地了解数据的分布特征,例如数据的集中程度、偏态以及异常值的存在等。通过观察直方图,我们可以更好地理解和分析数据,从而做出更准确的决策和预测。在统计学、市场研究、金融分析等领域,直方图被广泛应用于数据分析和可视化
# Display the original and equalized imagesfig, axes = plt.subplots(1, 2, figsize=(10, 5))axes[0].imshow(image, cmap='gray')axes[0].set_title("Original")axes[0].axis("off")axes[1].imshow(equalized_image, cmap='gray')axes[1].set_title("Equalized")axes[1].axis("off")plt.tight_layout()plt.show()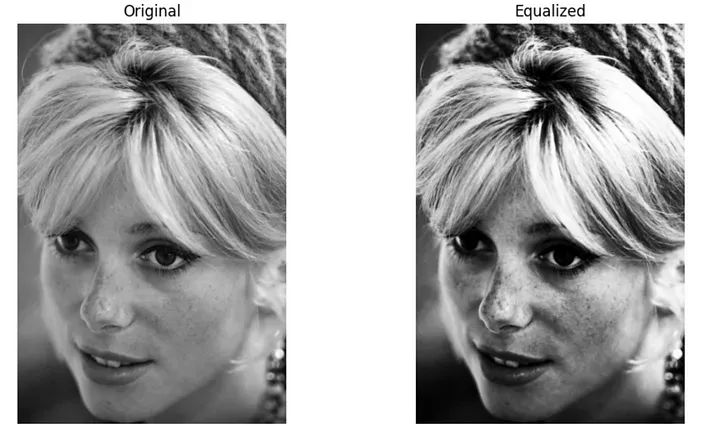
均衡化图像
缩放比例相等的比例尺称为线性缩放,也被称为对比度拉伸,用于调整图像的亮度和对比度,通过线性映射原始像素值到一个新的范围。该过程涉及重新缩放像素值,以利用图像中的最小值和最大值的完整动态范围
缩放比例相等的比例尺称为线性缩放的好处在于可以精确地控制亮度和对比度的调整。您可以根据具体需求定义所需的强度范围
import cv2import numpy as npimport matplotlib.pyplot as plt# Load the imageimage_path = "cath.jpeg"image = cv2.imread(image_path, cv2.IMREAD_GRAYSCALE)# Calculate the minimum and maximum pixel values in the imagemin_value = np.min(image)max_value = np.max(image)# Define the desired minimum and maximum intensity values for the output imagenew_min = 5new_max = 10# Perform linear scalingscaled_image = cv2.convertScaleAbs(image, alpha=(new_max - new_min) / (max_value - min_value), beta=new_min - min_value * (new_max - new_min) / (max_value - min_value))# Display the original and scaled imagesfig, axes = plt.subplots(1, 2, figsize=(10, 5))axes[0].imshow(cv2.cvtColor(image, cv2.COLOR_GRAY2RGB))axes[0].set_title("Original")axes[0].axis("off")axes[1].imshow(scaled_image, cmap='gray')axes[1].set_title("Scaled")axes[1].axis("off")plt.tight_layout()plt.show()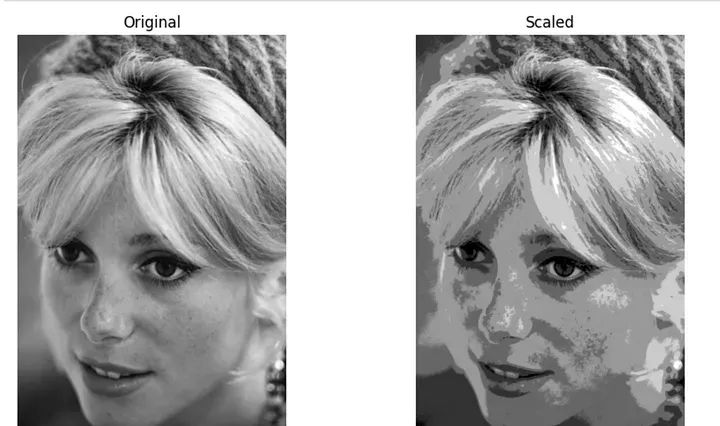
缩放比例相等的比例尺称为线性缩放
重写内容:Gamma 校正是一种技术,用于调整图像输入像素值和显示输出强度之间的非线性关系。它考虑到人类视觉系统对光的非线性响应,并旨在实现更准确和与感知一致的图像显示
相机捕捉或存储在图像文件中的像素值与人类感知亮度之间的关系是非线性的。换句话说,像素值的线性增加并不导致感知亮度的线性增加。这种非线性关系是由于成像传感器和人类视觉系统的响应特性导致的。
重写内容:Gamma 校正基于一个称为伽马(γ)的参数。伽马值表示输入像素值和显示输出强度之间的关系。它是两者之间非线性映射的度量。
重写内容:Gamma 校正对像素值应用幂律变换,调整强度值以校正非线性响应。重写内容:Gamma 校正的公式如下:
校正值 = 输入值 ^ (1 / 伽马)
这里,输入值代表原始像素值,校正值代表调整后的像素值。
重写内容:Gamma 校正的主要作用是补偿非线性强度关系,确保图像中的颜色和细节得到准确的表示。重写内容:Gamma 校正发挥重要作用的方式如下:
import cv2import numpy as npimage_path = "cath.jpeg"def adjust_gamma(image, gamma):# Build a lookup table mapping the input pixel values to the corrected gamma valueslookup_table = np.array([((i / 255.0) ** gamma) * 255 for i in np.arange(0, 256)]).astype(np.uint8)# Apply gamma correction using the lookup tablegamma_corrected = cv2.LUT(image, lookup_table)return gamma_corrected# Load the imageimage = cv2.imread(image_path)# Adjust the gamma valuegamma_value = 1.5gamma_corrected = adjust_gamma(image, gamma_value)# Display the original and gamma-corrected imagescv2.imshow("Original", image)cv2.imshow("Gamma Corrected", gamma_corrected)cv2.waitKey(0)cv2.destroyAllWindows()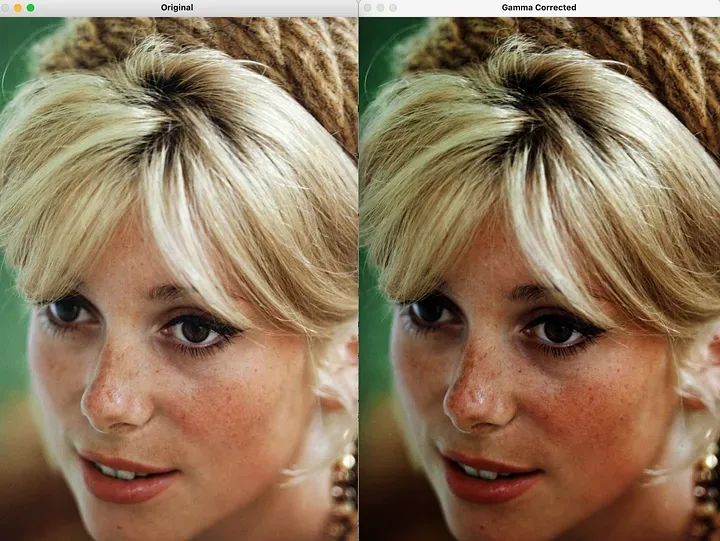
重写内容:Gamma 校正
几何变换使图像的透视、方向和空间关系发生变化。这些变换为图像对齐、目标检测、图像注册等任务提供了基本工具。
(1) 平移
移动是几何变换的基本形式之一,它涉及将图像在水平或垂直方向上移动指定的距离
import cv2import numpy as npimage_path = "cath.jpeg"image = cv2.imread(image_path)# Define the translation matrixtx = 100# pixels to shift in the x-axisty = 50# pixels to shift in the y-axistranslation_matrix = np.float32([[1, 0, tx], [0, 1, ty]])# Apply translationtranslated_image = cv2.warpAffine(image, translation_matrix, (image.shape[1], image.shape[0]))# Display the original and translated imagescv2.imshow("Original", image)cv2.imshow("Translated", translated_image)cv2.waitKey(0)cv2.destroyAllWindows()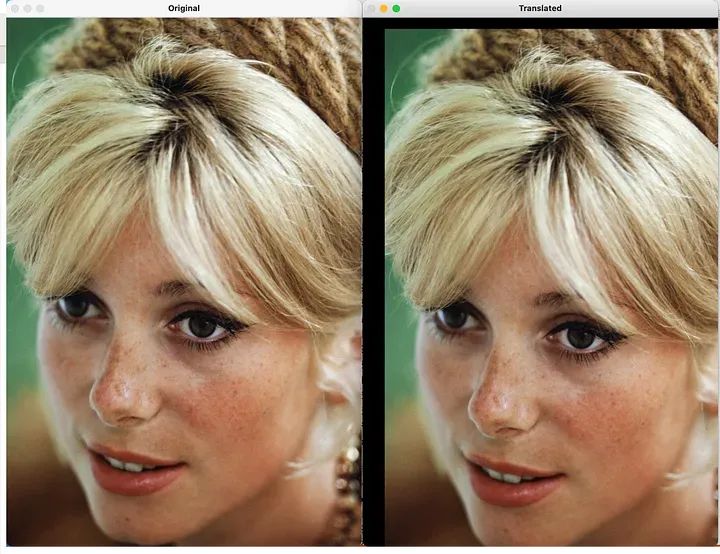
平移
(2) 缩放
缩放是指调整图像的大小,可以通过对所有维度应用统一的缩放因子,或者使用不同的缩放因子来调整不同的维度。已缩放。
# Define the scaling factorsscale_x = 1.5# scaling factor for the x-axisscale_y = 0.8# scaling factor for the y-axis# Apply scalingscaled_image = cv2.resize(image, None, fx=scale_x, fy=scale_y, interpolation=cv2.INTER_LINEAR)# Display the original and scaled imagescv2.imshow("Original", image)cv2.imshow("Scaled", scaled_image)cv2.waitKey(0)cv2.destroyAllWindows()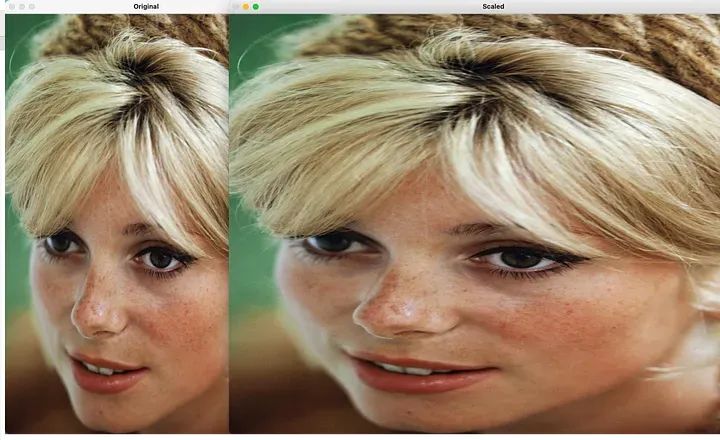
缩放
(3) 进行重写的内容是:旋转
进行重写的内容是:旋转是一种几何变换,涉及围绕中心点按指定角度更改图像的方向。
# Define the rotation angleangle = 30# Perform rotationrows, cols = image.shape[:2]rotation_matrix = cv2.getRotationMatrix2D((cols / 2, rows / 2), angle, 1)rotated_image = cv2.warpAffine(image, rotation_matrix, (cols, rows))# Display the original and rotated imagescv2.imshow("Original", image)cv2.imshow("Rotated", rotated_image)cv2.waitKey(0)cv2.destroyAllWindows()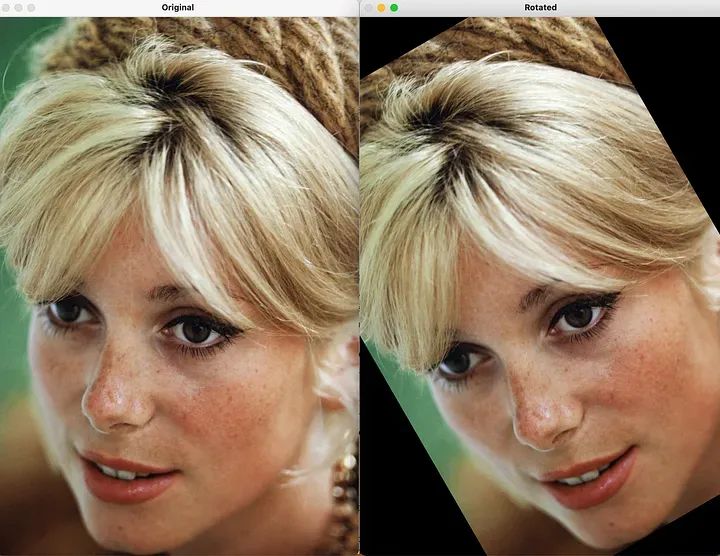
进行重写的内容是:旋转
以上是数字图像处理的图像操作的详细内容。更多信息请关注PHP中文网其他相关文章!


