最近群組有幾個人問,如何把echarts的圖表貼在three.js的模型上。這個問題其實很簡單,因為二者都是渲染成canvas的,直接用echarts產生的canvas當作貼圖就好了。
方法確定可行,那我們就直接開始擼程式碼。
先搭建一個three的基本場景起來,這裡不在複述。
然後新建一個平面,我們把圖片貼在這個平面上即可。
【相關課程推薦:JavaScript影片教學】
addPlane() {
    var geometry = new THREE.PlaneGeometry(10,10);
    var material = new THREE.MeshBasicMaterial({
        side: THREE.DoubleSide,
        // transparent:true
    });
    this.plane = new THREE.Mesh(geometry, material);
    this.scene.add(this.plane);
}擺好相機的角度,此時場景中是一個白板。

然後打開echarts的官網,找到案例,來個儀表板吧。代碼拷貝下來。跑起來。
為了方便演示,我在body中建立了2個div,分別作為three和圖表的容器。實際開發中圖表的容器不需要顯示出來的,也不需要加入body的。
<div id="webgl"   style="max-width:90%"></div>
<div id="echart" style="width:512px;height: 512px;margin-left: 620px;"></div>
var myChart = echarts.init(document.getElementById('echart'));
option = {
tooltip: {
formatter: "{a} <br/>{b} : {c}%"
},
//toolbox会在右上角生成两个功能按钮,咱们不需要,直接干掉。
// toolbox: {
// feature: {
// restore: {},
// saveAsImage: {}
// }
// },
series: [
{
name: '业务指标',
type: 'gauge',
detail: { formatter: '{value}%' },
data: [{ value: 50, name: '完成率' }]
}
]
};
option.series[0].data[0].value = (Math.random() * 100).toFixed(2) - 0;
myChart.setOption(option, true);
const dom = document.getElementById("webgl");
const scene = new Basescene(dom);
scene.addPlane();此時看到下面頁面:
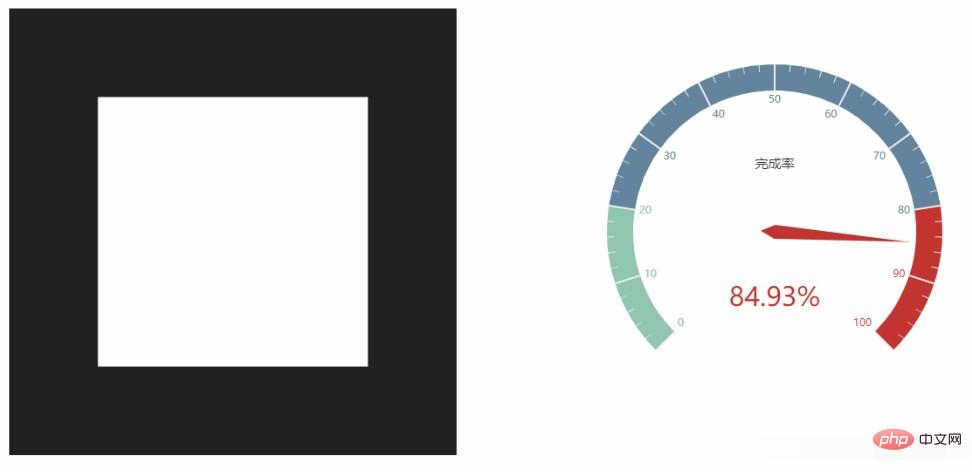
#方法一:CanvasTexture
three.js有一個api:CanvasTexture。可以傳入一個canvas對象,用這個方法可以完成上面的任務。
CanvasTexture( canvas : HTMLElement, mapping : Constant, wrapS : Constant, wrapT : Constant, magFilter : Constant, minFilter : Constant, format : Constant, type : Constant, aniFilpypy : Nee)# #運行結果如下,確實不清晰,和他們遇到的問題的一樣。試著把echarts畫大點,但是這個是自適應的,導致儀表板很醜,不是想像的樣子,如果是自己繪製的表格,就可以這樣處理了。
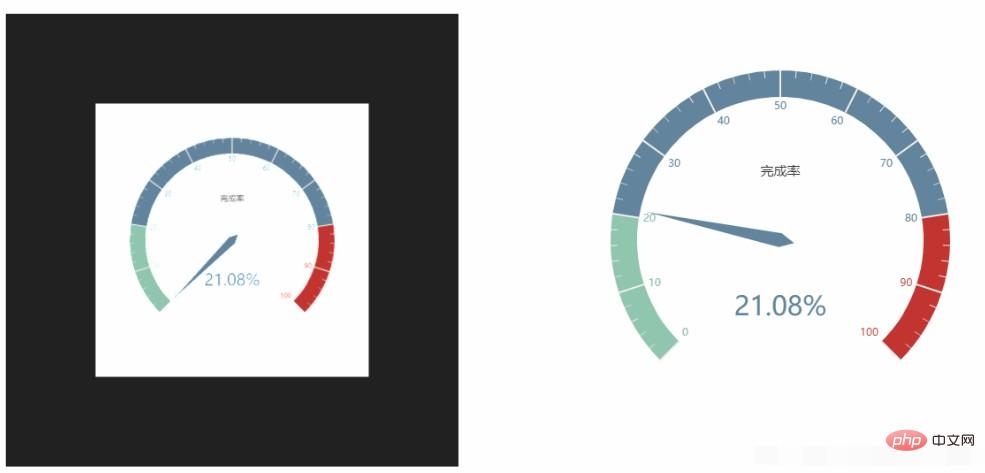
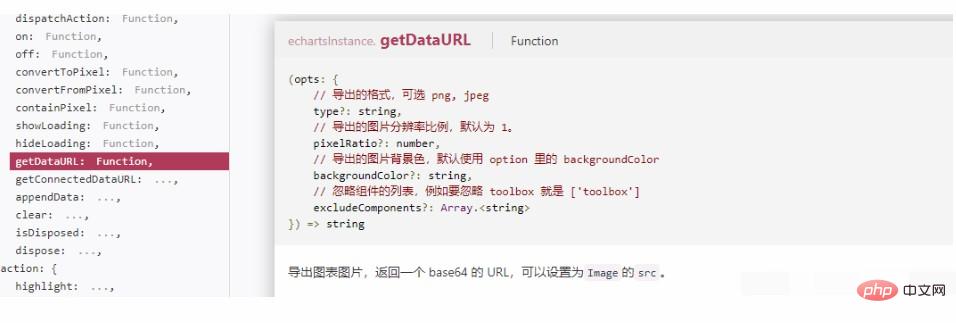
#既然echarts也是渲染canvas,看看api,應該要有方法匯出圖片。就是下面的api,而且有可選參數,可以設定解析度。
changeTextureT(texture){
    this.plane.material.map = new THREE.CanvasTexture(texture)
    this.plane.material.needsUpdate = true
    var thiscancas = document.getElementById("echart").getElementsByTagName('canvas')[0]
    scene.changeTextureT(thiscancas)
} 解析度設定為4確實清晰多了。
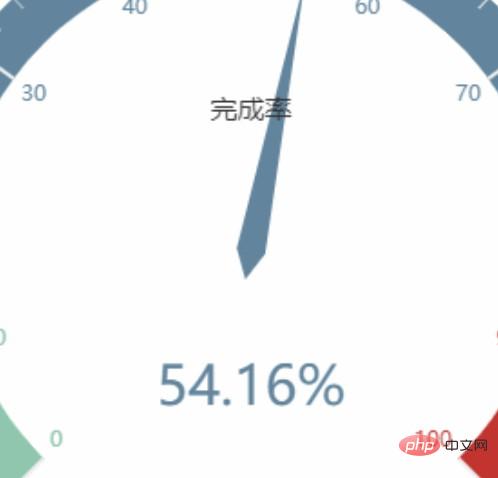
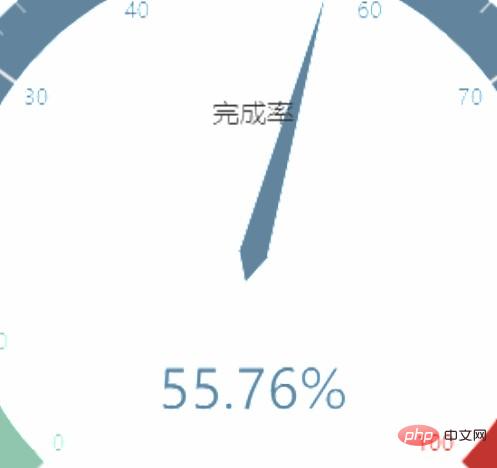 3圖區別很明顯,方法2>方法1。該使用什麼方法已經很懂了。
下面是動態圖片,開始沒有貼圖,然後貼上方法1產生的貼圖,接著閃一下,換成方法2解析度4產生的貼圖。放大還是很清晰的。
 最後問題:echarts的圖表很多都是有緩衝動畫的,如果也想在貼圖上即時刷新,可行嗎。幀率能跟上嗎。
全部程式碼:
changeTextureE(texture){
    this.plane.material.map = new THREE.TextureLoader().load(texture)
    this.plane.material.needsUpdate = true
}
var texture = myChart.getDataURL({
    pixelRatio: 4,
    backgroundColor: '#fff'
});
scene.changeTextureE(texture)本文來自
js教學以上是echarts產生的圖表在three.js中的應用詳解的詳細內容。更多資訊請關注PHP中文網其他相關文章!


