There is no doubt that the fields of machine learning and artificial intelligence have received more and more attention in recent years. As big data has become the hottest technology trend in the industry, machine learning has also achieved amazing results in prediction and recommendation with the help of big data. More famous machine learning cases include Netflix recommending movies to users based on users’ historical browsing behavior, and Amazon recommending books based on users’ historical purchasing behavior. This article mainly introduces the top ten algorithms that need to be understood in a brief discussion of machine learning. It has certain reference value and friends in need can refer to it.
So, if you want to learn machine learning algorithms, how do you get started? In my case, my introductory course was an artificial intelligence course I took while studying abroad in Copenhagen. The teacher is a full-time professor of applied mathematics and computer science at the Technical University of Denmark. His research direction is logic and artificial intelligence, mainly modeling using logic methods. The course includes two parts: discussion of theory/core concepts and hands-on practice. The textbook we use is one of the classic books on artificial intelligence: "Artificial Intelligence - A Modern Approach" by Professor Peter Norvig. The course involves intelligent agents, search-based solving, adversarial search, probability theory, multi-agent systems, and socialization. Artificial intelligence, as well as topics such as the ethics and future of artificial intelligence. Later in the course, the three of us also teamed up to do a programming project and implemented a simple search-based algorithm to solve transportation tasks in a virtual environment.
I learned a lot from the course and plan to continue to study in depth on this topic. Over the past few weeks, I’ve attended several talks on deep learning, neural networks, and data architecture in the San Francisco area—as well as a machine learning conference with many well-known professors. Most importantly, I signed up for Udacity's "Introduction to Machine Learning" online course in early June and completed the course content a few days ago. In this article, I would like to share a few common machine learning algorithms that I learned from the course.
Machine learning algorithms can usually be divided into three major categories - supervised learning, unsupervised learning and reinforcement learning. Supervised learning is mainly used in scenarios where a part of the data set (training data) has some familiarity (labels) that can be obtained, but the remaining samples are missing and need to be predicted. Unsupervised learning is mainly used to mine implicit relationships between unlabeled data sets. Reinforcement learning is somewhere in between - each step of prediction or behavior has more or less feedback information, but there is no accurate label or error prompt. Since this is an introductory course, reinforcement learning is not mentioned, but I hope the ten algorithms for supervised and unsupervised learning are enough to whet your appetite.
Supervised learning
1. Decision tree:
The decision tree is a decision support tool that uses a tree diagram or tree model To represent the decision-making process and subsequent results, including probabilistic event results, etc. Please observe the diagram below to understand the structure of the decision tree.

#From the perspective of business decision-making, a decision tree is to predict the probability of a correct decision through as few right and wrong judgment questions as possible. This approach can help you use a structured, systematic approach to draw reasonable conclusions.
2. Naive Bayes classifier:
The Naive Bayes classifier is a simple probabilistic classifier based on Bayesian theory. It assumes Features were previously independent of each other. The figure below shows the formula - P(A|B) represents the posterior probability, P(B|A) is the likelihood value, P(A) is the prior probability of the category, and P(B) represents the predictor. Priori probability.

Some examples from real-life scenarios include:
Detect spam emails
Category news into categories like technology, politics, sports, etc.
Judge whether a piece of text expresses positive or negative emotions
Used for face detection software
3. Least squares regression:
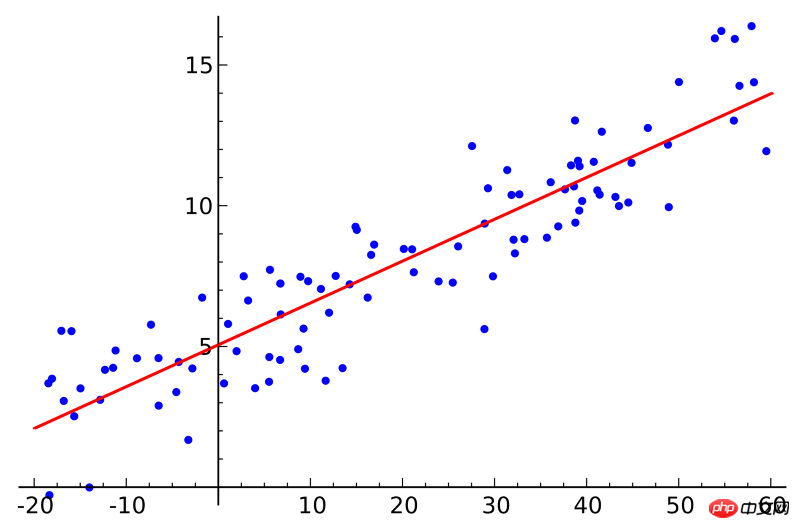
If you have taken a statistics course, you may have heard of the concept of linear regression. Least squares regression is a method of linear regression. You can think of linear regression as fitting a straight line to a number of points. There are many fitting methods. The "least squares" strategy is equivalent to drawing a straight line, then calculating the vertical distance from each point to the straight line, and finally summing up the distances; the best-fitting straight line is the one with the smallest sum of distances. That one.

#Linear refers to the model used to fit the data, while least squares refers to the loss function to be optimized.
4. Logistic regression:
The logistic regression model is a powerful statistical modeling method that uses one or more explanatory variables to output binary results. Modeling. It uses the logistic function to estimate the probability value to measure the relationship between a categorical dependent variable and one or more independent variables, which belongs to the cumulative logistic distribution.

Generally speaking, the application of logistic regression models in real-life scenarios includes:
Credit score
Predicting the probability of success of business activities
Predict the income of a certain product
Predict the probability of an earthquake on a certain day
5. Support vector machine:
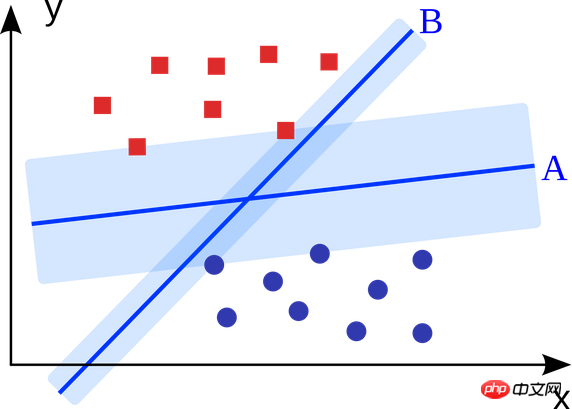
The support vector machine is A binary classification algorithm. Given two types of points in N-dimensional space, the support vector machine generates a (N-1)-dimensional hyperplane to classify these points into two categories. For example, there are two types of linearly separable points on paper. The support vector machine finds a straight line that separates these two types of points and is as far away from each of them as possible.

Large-scale problems solved using support vector machines (improved based on specific application scenarios) include display advertising, human body joint part recognition, image-based gender checking, large-scale Image classification, etc...
6. Integration method:
The integration method is to first build a set of classifiers, and then use the weighted voting of each classifier to predict new Data algorithms. The original ensemble method was Bayesian averaging, but more recent algorithms include error-corrected output encoding and boosting algorithms.

So what is the principle of the integrated model, and why does it perform better than the independent model?
They eliminate the effect of bias: for example, if you mix the Democratic Party's questionnaire with the Republican Party's questionnaire, you will get neutral information that is neither fish nor fowl.
They can reduce the variance of predictions: the prediction results of multiple models aggregated are more stable than the prediction results of a single model. In the financial world, this is called diversification—a blend of stocks always moves much less than a single stock. This also explains why the model will become better as the training data is increased.
They are not prone to overfitting: If a single model does not overfit, then simply combining the prediction results of each model (mean, weighted average, logistic regression), there is no reason to overfit. fitting.
Unsupervised learning
7. Clustering algorithm:
The task of the clustering algorithm is to cluster a group of objects into multiple groups. Objects in the same group (cluster) are more similar than objects in other groups.

Each clustering algorithm is different, here are a few:
Center-based clustering algorithm
Connection-based clustering algorithm
Density-based clustering algorithm
Probabilistic algorithm
Dimensionality reduction algorithm
Neural network/deep learning
8. Principal component analysis:
Principal component analysis is a statistical method. Through orthogonal transformation, a group of variables that may be correlated are converted into a group of linearly uncorrelated variables. variables, the transformed set of variables is called the principal component.

Some practical applications of principal component analysis include data compression, simplified data representation, data visualization, etc. It is worth mentioning that domain knowledge is required to judge whether it is suitable to use the principal component analysis algorithm. If the data is too noisy (that is, the variance of each component is large), it is not suitable to use the principal component analysis algorithm.
9. Singular value decomposition:
Singular value decomposition is an important matrix decomposition in linear algebra and a generalization of normal matrix unitary diagonalization in matrix analysis. . For a given m*n matrix M, it can be decomposed into M=UΣV, where U and V are m×m order unitary matrices, and Σ is a positive semidefinite m×n order diagonal matrix.

Principal component analysis is actually a simple singular value decomposition algorithm. In the field of computer vision, the first face recognition algorithm used principal component analysis and singular value decomposition to represent the face as a linear combination of a set of "eigenfaces", after dimensionality reduction, and then used simple methods to match Candidate face. Although modern methods are more sophisticated, many techniques are similar.
10. Independent component analysis:
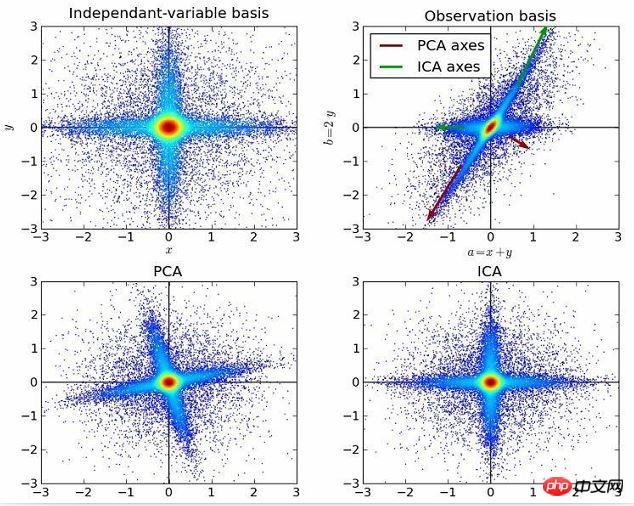
Independent component analysis is a method that uses statistical principles to perform calculations to reveal the hidden factors behind random variables, measurements, or signals. . The independent component analysis algorithm defines a generative model for observed multivariate data, usually large batches of samples. In this model, the data variables are assumed to be linear mixtures of some unknown latent variables, and the mixture system is also unknown. The latent variables are assumed to be non-Gaussian and independent, and they are called independent components of the observed data.

Independent component analysis is related to principal component analysis, but it is a more powerful technique. It can still find the underlying factors of the data source when these classic methods fail. Its applications include digital images, document databases, economic indicators, and psychometric measurements.
Now, please use the algorithms you understand to create machine learning applications and improve the quality of life of people around the world.
Related recommendations:
WeChat mini program robot automatic customer service function


