
It is important to navigate between the code you want to inspect. It would be tedious and unnecessary to go through every line of code. The debugger provides a convenient way to see what's important and jump out of unimportant blocks of code. Let's see how to enter, skip, and exit functions while debugging!
InPrevious article, we studied the VS Code debugger, added breakpoints in the code, and also viewed the local status.
This time, we'll learn how to step through code line by line and how to jump in and out of function calls.
Get the code
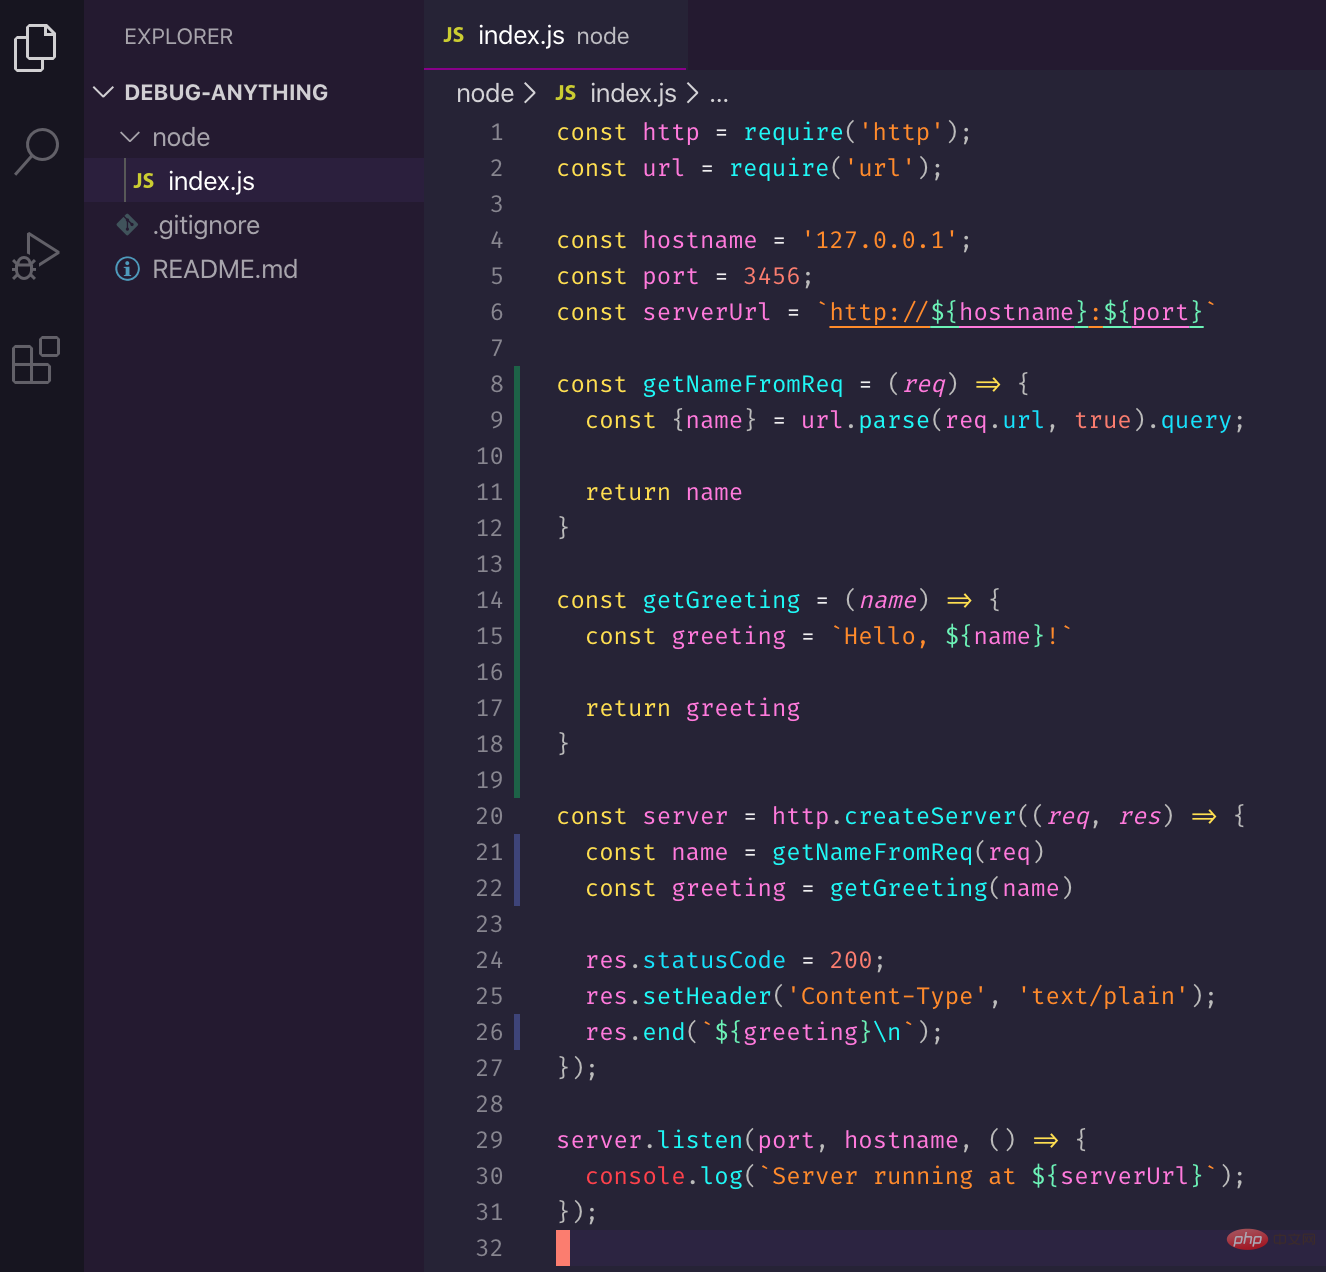
First, let’s make the last server modification more complex. Add two extra functions: one to get the name from the request and another to generate the greeting.
You can paste the following code intoindex.js.
const http = require('http'); const url = require('url'); const hostname = '127.0.0.1'; const port = 3456; const serverUrl = `http://${hostname}:${port}` const getNameFromReq = (req) => { const {name} = url.parse(req.url, true).query; return name } const getGreeting = (name) => { const greeting = `Hello, ${name}!` return greeting } const server = http.createServer((req, res) => { const name = getNameFromReq(req) const greeting = getGreeting(name) res.statusCode = 200; res.setHeader('Content-Type', 'text/plain'); res.end(`${greeting}\n`); }); server.listen(port, hostname, () => { console.log(`Server running at ${serverUrl}`); });

The code of this series can be obtained at https://github.com/thekarel/debug-anything
Start the debugger
Let's start the debugger: Use the debug toolbar or pressF5and selectNode.js:

You should be able to accesshttp://127.0.0.1:3456/?name=Cocoand See the greeting.
If you like the command line, you can also use
curl http://127.0.0.1:3456\?name\=Cocoto access.
Okay, now that the server is up and running, let's add a breakpoint. The debugger will not start without a breakpoint:

Add a breakpoint on line 21:
const name = getNameFromReq(req)
Step by Step debugging
Trigger the pair againhttp://127.0.0.1: 3456/?name=Coco, the debugger will be activated and stop at line 21 of the code:
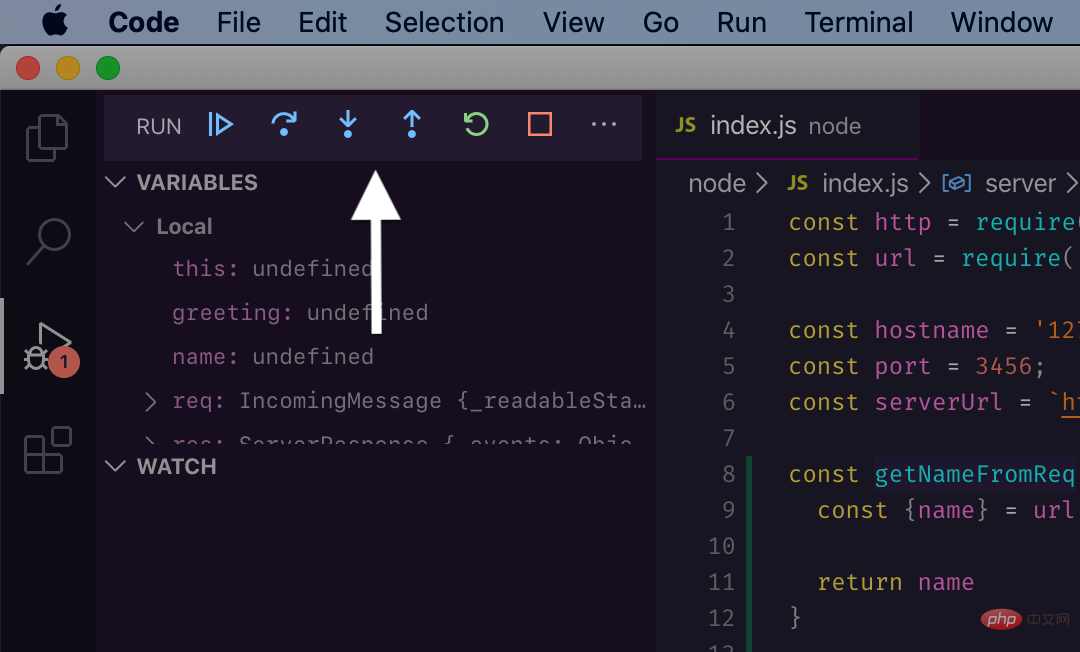
##pretty! Now let's focus on the
Debug Toolbar:


still execute all codeas usual. The debugger won't make you bored, and you'll be able to complete your main work faster.
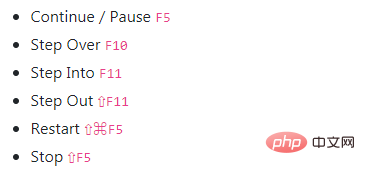
Continue
Continue will run the code until the next breakpoint or the end of the program. One way to debug is to add multiple breakpoints on the relevant lines beforehand and jump between them with continue:
Step Over
You can think of Step Over as stepping through the function line by line, but without entering the function call. Use it if you are not interested in the internal logic of the function call in the current line, but just want to see how local variables change over time, for example:
declarative code.
Step Into
When a line calls a function that interests you and you want to dig deeper, you can use Step Into. Once inside the code block, you can debug as usual (using continue, step, etc.).
Observe how we skipgetNameFromReqand then entergetGreeting:

Step Out
Step Out is the opposite of Step In: if you are no longer interested in a function, you can leave it. Using "Step out" will run the rest of the function's code in one go.
Check the difference between these two functions through debugging. We execute the first function line by line, but exit the second function early:

Now, you should have a better understanding of the debugger toolbar, how tofocus on the important thingsand skip the irrelevant parts. Not only will these commands save you time, they will make the entire debugging job more enjoyable! Why not try it in your project?
VSCode debugging tutorial series:
English original address: https://charlesagile.com/debug-javascript-typescript-debugger-navigating-with-steps
Author: Charles Szilagyi
Recommended related tutorials:vscode introductory tutorial
The above is the detailed content of VSCode debugging tutorial (2): step-by-step debugging. For more information, please follow other related articles on the PHP Chinese website!