Course Intermediate 11331
Course Introduction:"Self-study IT Network Linux Load Balancing Video Tutorial" mainly implements Linux load balancing by performing script operations on web, lvs and Linux under nagin.

Course Advanced 17634
Course Introduction:"Shangxuetang MySQL Video Tutorial" introduces you to the process from installing to using the MySQL database, and introduces the specific operations of each link in detail.

Course Advanced 11348
Course Introduction:"Brothers Band Front-end Example Display Video Tutorial" introduces examples of HTML5 and CSS3 technologies to everyone, so that everyone can become more proficient in using HTML5 and CSS3.
How to use Vue-Chartjs to dynamically update line charts efficiently?
2024-01-29 13:35:31 0 1 565
2023-09-14 23:54:56 0 1 593
2024-02-04 10:24:44 0 1 467
Ways to fix issue 2003 (HY000): Unable to connect to MySQL server 'db_mysql:3306' (111)
2023-09-05 11:18:47 0 1 825
Experiment with sorting after query limit
2023-09-05 14:46:42 0 1 726
Course Introduction:Example code for dynamically generating line charts with PHP GD library
2016-07-25 comment 0 1537
Course Introduction: PHP实现动态生成饼状图、柱状图和折线图(转) PHP在图像操作方面的表现非常出色,我们只需借助可以免费得到的GD库便可以轻松实现图、表勾画。下面将分别介绍PHP实现的饼状图、折线图和柱状图以及他们的使用方法,这几段代码的特点就是不需要再把它们复制到你的代码之中,只需要把计算得到的数据作为参数传入,即可得到相应的图形效果代码中所有使用的函数的说明
2016-06-13 comment 0 1263

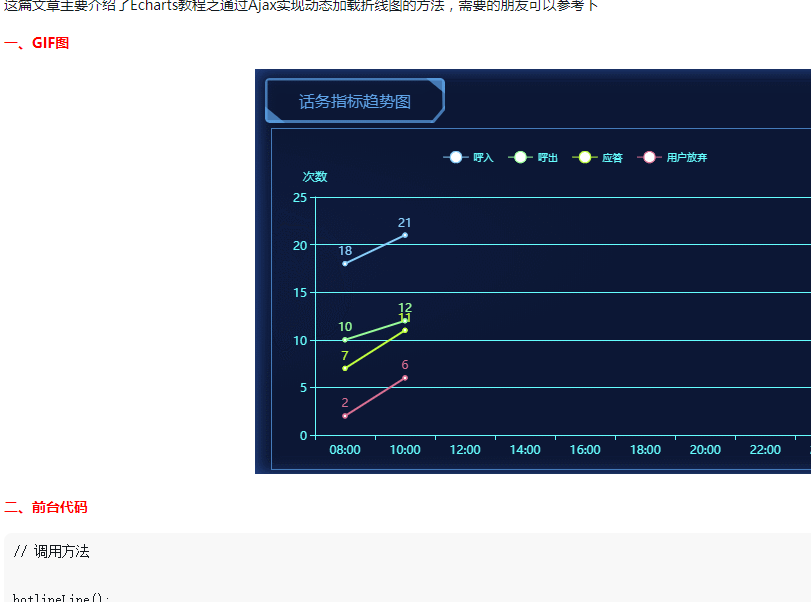
Course Introduction:This article mainly introduces the Echarts tutorial method of dynamically loading line charts through Ajax. Friends in need can refer to it.
2018-05-21 comment 0 2642

Course Introduction:Practical Guide: Using matplotlib to draw line charts to solve practical problems Introduction Data visualization plays an important role in solving practical problems. The line chart is the most commonly used and common chart type. In this article, we will introduce how to use Python's matplotlib library to draw a line chart, and solve practical problems through specific code examples. 1. Preparation Before starting, we need to install the matplotlib library. Open a terminal or command prompt and enter the following command to install
2024-01-17 comment 0 1200

Course Introduction:Line charts are a very common way of displaying data in our daily data visualization, and I think everyone is already familiar with it. Line charts are very simple and everyone can make them, but the line charts produced by different people vary widely. Most people's line charts are generated by directly inserting the default line chart style. Regardless of whether they have made such a line chart carefully, the boss is tired of looking at it just because of this style. Today, this article will teach you how to make a high-quality line chart. Let’s take a look!
2023-04-12 comment 0 6841