Course Intermediate 11357
Course Introduction:"Self-study IT Network Linux Load Balancing Video Tutorial" mainly implements Linux load balancing by performing script operations on web, lvs and Linux under nagin.

Course Advanced 17659
Course Introduction:"Shangxuetang MySQL Video Tutorial" introduces you to the process from installing to using the MySQL database, and introduces the specific operations of each link in detail.

Course Advanced 11374
Course Introduction:"Brothers Band Front-end Example Display Video Tutorial" introduces examples of HTML5 and CSS3 technologies to everyone, so that everyone can become more proficient in using HTML5 and CSS3.
Implementing multiple buttons in React: deselecting all buttons except the one clicked
2024-02-26 15:26:22 0 1 340
Ways to fix issue 2003 (HY000): Unable to connect to MySQL server 'db_mysql:3306' (111)
2023-09-05 11:18:47 0 1 851
Experiment with sorting after query limit
2023-09-05 14:46:42 0 1 738
CSS Grid: Create new row when child content overflows column width
2023-09-05 15:18:28 0 1 631
PHP full text search functionality using AND, OR and NOT operators
2023-09-05 15:06:32 0 1 601

Course Introduction:Photoshop is an outstanding software in the field of digital image processing. At the same time, it also allows third parties to extend its functions in the form of plug-ins. Photoshop plug-ins can currently be divided into the following nine types: automation (batch processing) (appears under the 'Auto' submenu), color pickup, import, export (appears under the 'Import' 'Export' submenu), extension, Filters, File Format (appears under Open, Save As), Parsing (with Export function), Selection (appears under 'Select' menu). Here we take the most familiar filter as an example.
2017-02-20 comment 0 3281

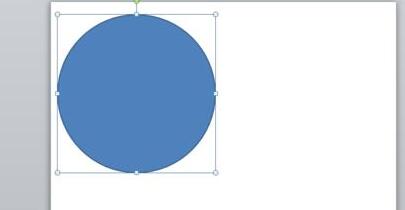
Course Introduction:1. Insert an ellipse, [Insert - Shape - Ellipse], and press shift + left button to draw a circle. 2. After inserting the circle, copy another circle, making a total of two circles. 3. Select two circles respectively and set them to [No Outline]. 】Format - Shape Outline - No Outline【. 4. Select two circles respectively and choose any two colors. I used orange and purple as examples. 】Format - Shape Fill - Select Color【. 5. Select a circle and change it to [Hollow Arc]. 】Format-Insert Shape-Edit Shape-Select Hollow Arc【. 6. Click on the hollow arc to adjust the height and shape. 7. Click on the hollow arc and drag it into the circle. And select all, center top and bottom, center left and right. 8. Select the circle, edit the text, and enter the proportion value visually.
2024-03-26 comment 0 926

Course Introduction:1. Why do the words under my document turn blue? If the font in your document suddenly turns blue, this may be due to one of the following reasons: 1. Hyperlink effect: If you insert a hyperlink in your document, usually by default, the hyperlink text will appear blue color. This is the default setting for many text editors. 2. Style change: Maybe when editing the document, the font style was accidentally changed and the font color was set to blue. 3. Document template: If the document uses a specific template, the font color defined in the template may affect the text color in the document. 2. How to solve this situation when the font turns blue? If you want to solve the problem of fonts turning blue in the document, you can take the following steps: 1. Check the hyperlinks: Find the blue fonts in the document
2024-01-07 comment 0 3482

Course Introduction:1. Click [Insert] above the Word document. 2. Click [Shape] in the toolbar. 3. Find the Flowchart: Off-page Connector icon in the Flowchart in the shape, and click the Flowchart: Off-page Connector icon. 4. Press and hold the left mouse button in the blank space of the document and pull the mouse to insert a flow chart: off-page connector. 5. Click to select the flow chart in the document: off-page connector, and click the [Shape Fill] icon on the right. 6. Click [No Fill Color] above the color. 7. In this flow chart: there is no fill color in the off-page connector.
2024-04-24 comment 0 1203

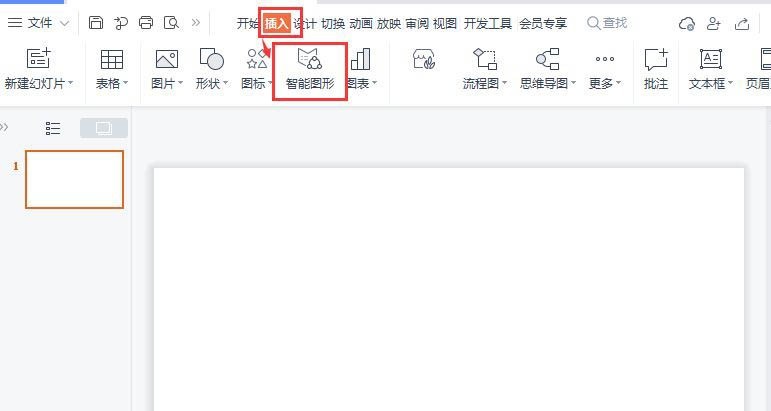
Course Introduction:1. We open ppt, click [Insert] and select [Smart Graphics], as shown in the figure. 2. We find the chart type we like in the smart graph of [Total Score], and then click [Free Use], as shown in the picture. 3. Next, we can select the number of items according to our needs, for example: 4 items, and then click [Use Now], as shown in the figure. 4. We now see that the relationship chart of the total score has been inserted into the ppt document, but it looks a bit small, as shown in the picture. 5. We adjust the chart to a suitable size, then select the ring and set the fill color to [purple], as shown in the picture. 6. Next, we select the four arrows together, and then change the color to [orange], as shown in the picture. 7. Finally, let’s take a look at changing the appearance
2024-06-06 comment 0 545