CourseIntermediate4426
Course Introduction:There are two main purposes for studying this course: 1. Visual panel layout adapts to the screen 2. Use ECharts to realize histogram display Core Technology: -Based on flexible.js + rem smart large screen adaptation - VScode cssrem plug-in - Flex layout - Less to use - Based on ECharts data visualization display - ECharts histogram data settings - ECharts map introduction

CourseIntermediate5818
Course Introduction:This course is a very comprehensive set of courses. The video knowledge covers the basics, advanced, operation and maintenance of MySQL and many other aspects. The course content is comprehensive and in-depth, which can fully meet our daily development, operation and maintenance, interviews, and self-improvement. It also uses a variety of methods during the explanation process to help students understand the key and difficult content in the course more clearly.

CourseElementary20709
Course Introduction:Use PDO mode (PHP data object) to connect and select databases (unified operation of various databases), execute SQL statements and process result sets

CourseElementary1790
Course Introduction:Python visualization video series using matplotlib, seaborn, pyecharts, combined with real data sets; this video is reproduced from Bilibili: BV1gz411v7F5

CourseIntermediate8091
Course Introduction:Many programmers who have worked for many years still have a very basic understanding of databases. They are confused as soon as they go out for interviews. They don’t understand basic SQL statements, more complex SQL queries, and SQL statement optimization. They don’t even know how to use them. Redis improves system performance and can withstand tens of millions of concurrencies. This set of courses will help you thoroughly understand MySQL locks, execution plans, indexes, MVCC & Redis transactions, cache, breakdown, penetration, avalanche, warm-up, etc., and you can complete all database interviews in one set!
Where are the codes for the conn.php and functions.php files?
2018-04-12 17:39:53 0 2 1767
2018-12-22 13:07:35 0 0 1140
2020-04-24 10:41:44 0 2 1073

Course Introduction:Guide to Dataset to Datatable C#. Here we discuss introduction, convert dataset to datatable C#, difference, creating a table C# & example.
2024-09-03 comment 0618

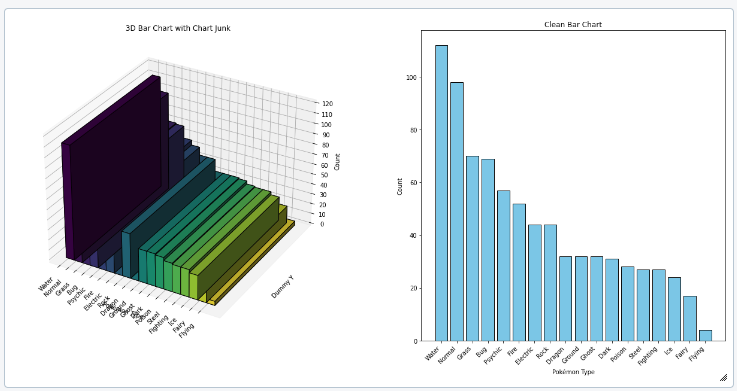
Course Introduction:Why use data vis When you need to work with a new data source, with a huge amount of data, it can be important to use data visualization to understand the data better. The data analysis process is most of the times done in 5 steps: Extract -
2024-09-07 comment 0982

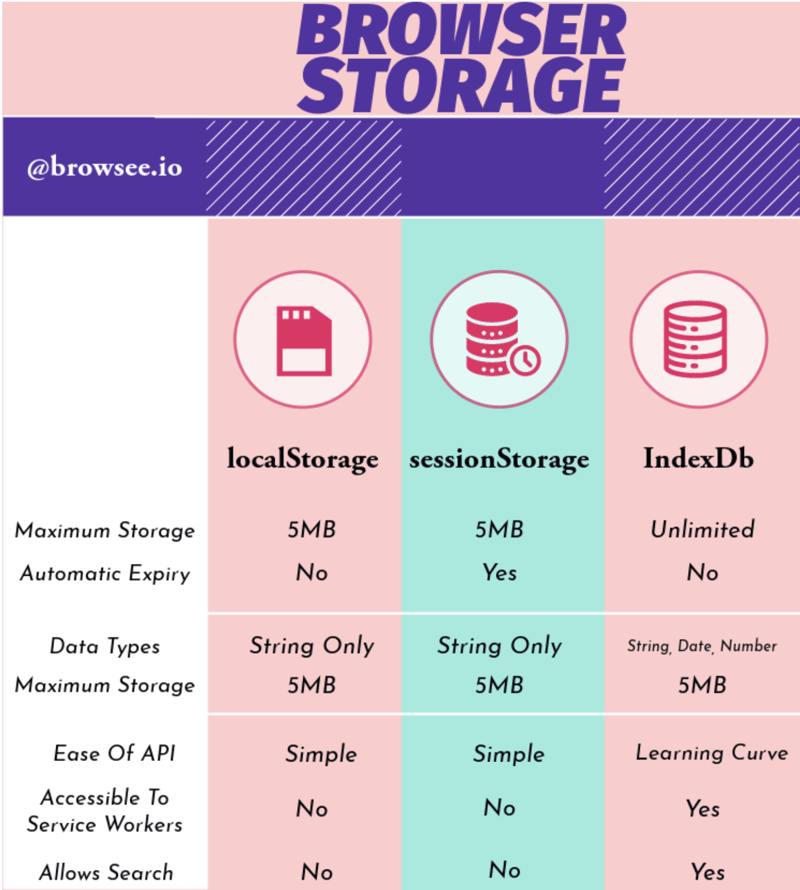
Course Introduction:What Question Does IndexedDB Solve? IndexedDB is a solution to store large amounts of structured data, even offline. It solves the problem of efficient local storage for web applications, enabling them to access, update, and query large data
2024-09-06 comment 0694

Course Introduction:What Question Does IndexedDB Solve? IndexedDB is a solution to store large amounts of structured data, even offline. It solves the problem of efficient local storage for web applications, enabling them to access, update, and query large data
2024-09-06 comment 0809

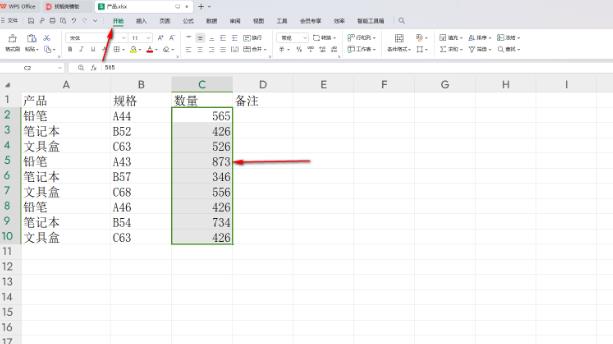
Course Introduction:WPS can process some data. If you want to display the data in the style of a progress bar, you can directly create a new rule in WPS through the data bar function and set the maximum and minimum numbers. The data bar will be represented according to the data size value you set. The specific method is as follows. Setting method 1. First select all the data to be set, and then click the [Start] menu. 2. Click the [Conditional Formatting] option in the toolbar, click the [Data Bar] option in the open drop-down option, and select [Other Rules] in the open sub-option. 3. Select the first option, and then in the [Type] position below, set both the [Maximum Value] and [Minimum Value] options to [Number].
2024-09-03 comment 01005