

Course Advanced 10606
Course Introduction:Java online learning Web application uploads pictures to generate thumbnails. The course "Java Video Tutorial for Implementing Equal-proportioned Thumbnails of Images" explains how to use Java to implement the function of generating equal-proportioned thumbnails of images in the form of examples. The performance of information browsing is improved through thumbnail generation, which reduces the amount of data transmission while ensuring user experience.

Course Advanced 9543
Course Introduction:"In-depth Learning of Image Upload Function Example for PHP Development" introduces the development of image upload function.

Course Elementary 24880
Course Introduction:Small cases for quick calculations on various graphics

Course Advanced 19062
Course Introduction:"PHP Image Upload Tutorial" teaches you how to use our PHP and a PHP image upload class to implement our image upload function.

Course Elementary 18711
Course Introduction:In the HTML code example tutorial, you can learn about CSS background, CSS text, CSS font, CSS link, CSS list, CSS table, CSS box model, CSS border, CSS outline, CSS margin, CSS padding, CSS size , CSS positioning, CSS floating, CSS aligned elements, CSS selectors, CSS images, CSS application examples, etc. Basic knowledge
2017-05-16 13:37:59 0 1 419
javascript - What is the maximum compression ratio for canvas compressed images?
2017-06-12 09:28:20 0 1 900
EchartJS - select legend and show only selected items
2023-09-14 00:15:04 0 1 421
Limit image proportions using JavaScript
2024-02-17 20:13:49 0 1 426
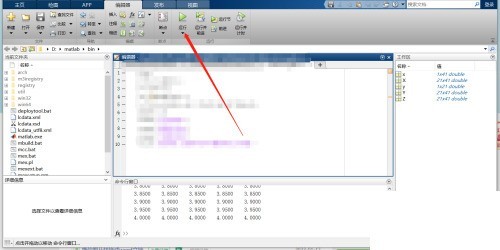
Course Introduction:1. First open the program on the matlab page and select the run option. 2. Then select the Insert Legend option in the pop-up graph. 3. Finally, double-click to edit the legend.
2024-04-09 comment 0 1162
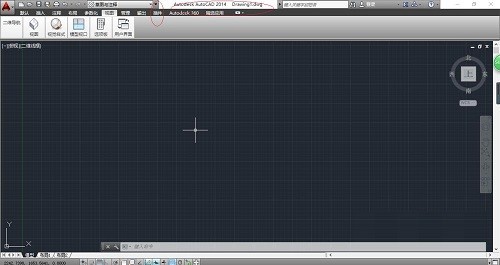
Course Introduction:Step 1: First open the AutoCAD2014 software and click the downward arrow on the custom quick access toolbar, as shown in the figure below. Step 2: Pop up the drop-down list options. Select the "Show Menu Bar" item to display the system menu bar, as shown in the figure below. Step 3: Call up the "System Menu Bar" area and click the "Format" icon, as shown in the figure below. Step 4: The "Format" menu item pops up. Select the "Scale List..." item to set the drawing scale of the graphic, as shown in the figure below. Step 5: The "Edit Drawing Scale" dialog box pops up, click the "Add..." button, enter the name displayed in the scale list, set the drawing unit and drawing unit, as shown in the figure below. Step 6: Finally, you can complete the operation of setting the drawing scale of the graphics, as shown in the figure below
2024-05-08 comment 0 496
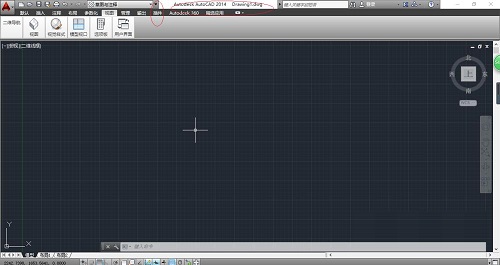
Course Introduction:Many friends don’t know how to set the graphics drawing ratio in AutoCAD 2014, so the editor below will share the method of setting the graphics drawing ratio in AutoCAD 2014. Let’s follow the editor to take a look. I believe it will be helpful to everyone. How to set graphics drawing scale in AutoCAD 2014? The first step to set the graphics drawing scale in AutoCAD 2014: First open the AutoCAD 2014 software and click the downward arrow on the custom quick access toolbar, as shown in the figure below. Step 2: Pop up the drop-down list options. Select the "Show Menu Bar" item to display the system menu bar, as shown in the figure below. Step 3: Call up the "System Menu Bar"
2024-08-19 comment 0 318

Course Introduction:Optimization of legends and descriptions of Vue statistical charts In web development, statistical charts are a common way to present data. Vue is a popular JavaScript framework that helps us build interactive and dynamic web applications. When we use Vue to create statistical charts, we often need to add legends and descriptions to the chart to improve readability and user experience. This article will introduce how to optimize the legends and descriptions of Vue statistical charts, and provide code examples. Using legends Legends are used to explain different elements in a chart
2023-08-17 comment 0 713

Course Introduction:How to draw a use case diagram in PowerDesigner Sequence diagram Collaboration diagram State diagram Activity diagram Create a use case diagram, open PD, do as follows: To solve this puzzle, we need to follow the following steps. First, open the software and select the "File" option, and find the "Create New Model (NewModel)" option in the drop-down menu. Next, select "Categories" and then "Business." In the business model, select "UseCaseDefinition". Now, you will see an interface with a small man symbol and a use case symbol on the panel. By dragging and connecting these symbols, you can manipulate the relationships between use cases. if you want
2024-01-09 comment 0 2058