current location:Home > Mysql数据图标 search
Found a total of 8051 related content
-

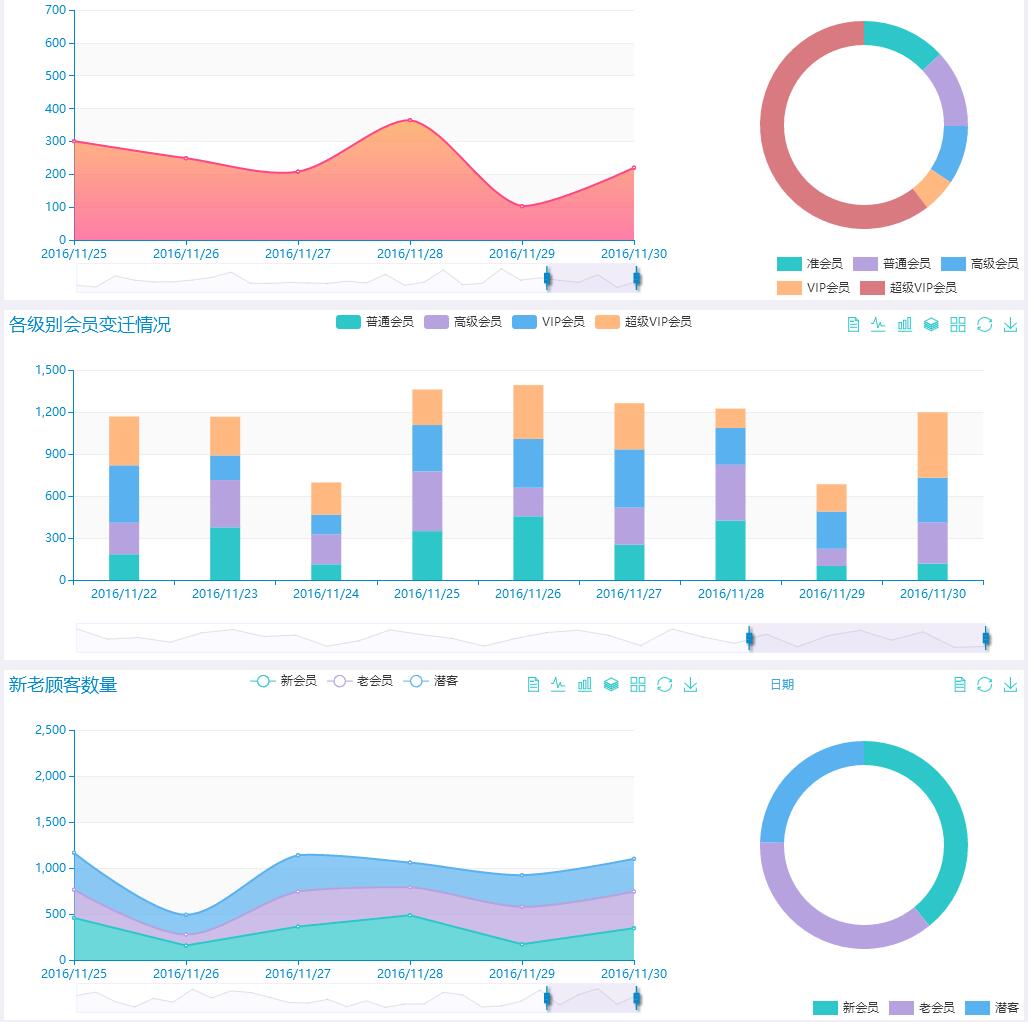
- Data analysis, data graphics, chart plug-in echarts
- Data analysis, data graphics, chart plug-in echarts
- 2019-09-30 190 2661
-

- json pie chart data chart code
- json pie chart data chart code
- 2017-11-27 171 1559
-

- ETS commonly used data statistics charts
- ETS commonly used data statistics charts
- 2019-09-30 168 3556
-

- jQuery echarts histogram data statistics chart plug-in
- jQuery echarts histogram data statistics chart plug-in
- 2018-05-22 160 3086
-

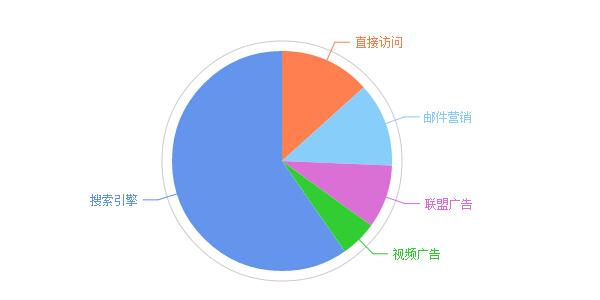
- echarts implements pie-shaped data statistical graphics code
- echarts implements pie-shaped data statistical graphics code
- 2017-02-08 185 1915
-

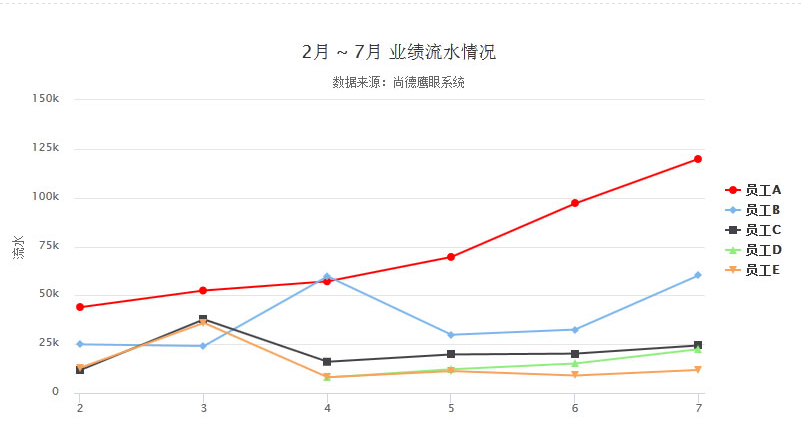
- highcharts.js employee performance line chart data chart code
- highcharts.js employee performance line chart data chart code
- 2018-05-17 228 1853
-

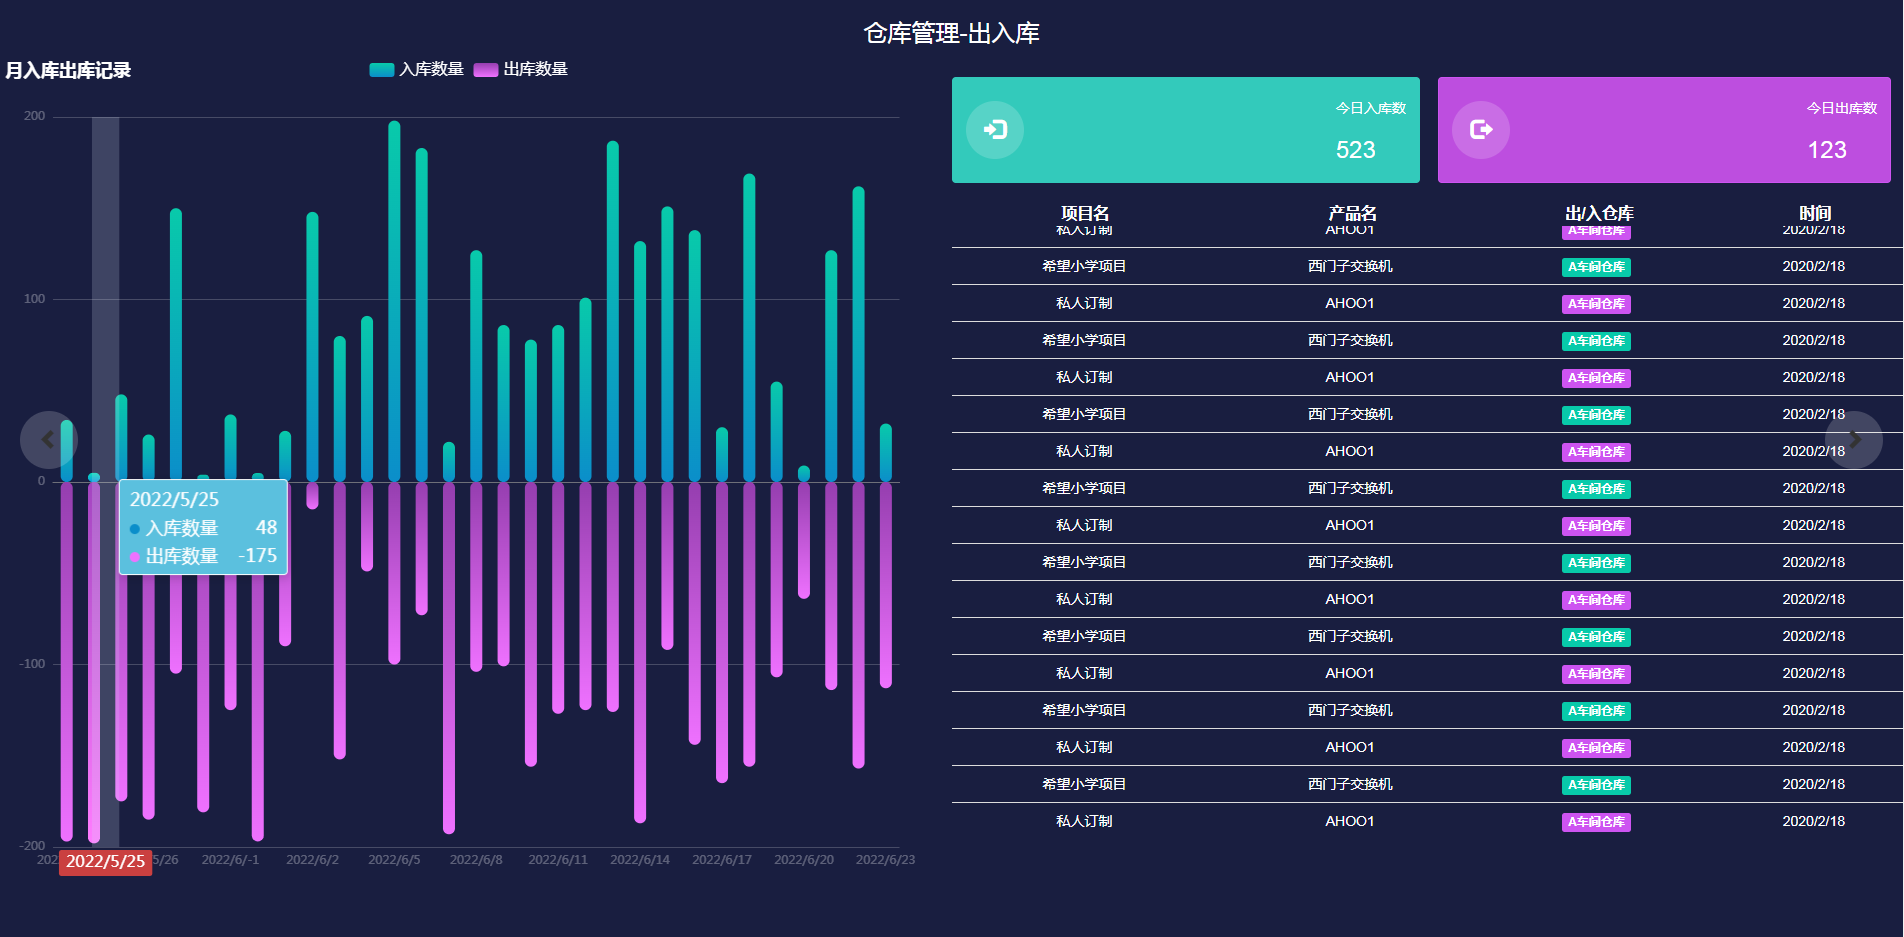
- Warehouse management inbound and outbound data statistical chart
- A statistical chart of warehouse management incoming and outgoing data
- 2022-06-24 174 2289
-

- angular+echart-js statistical chart reading screen display code
- angular+echart-js statistical chart reading screen display code
- 2018-01-19 181 2675
-

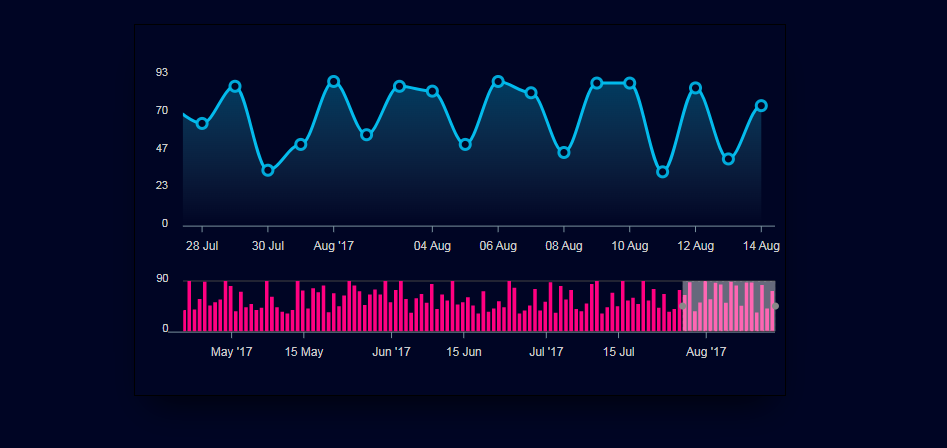
- Very beautiful HTML5 data curve chart style code
- A very beautiful HTML5 data curve chart style code
- 2023-04-13 95 606
-

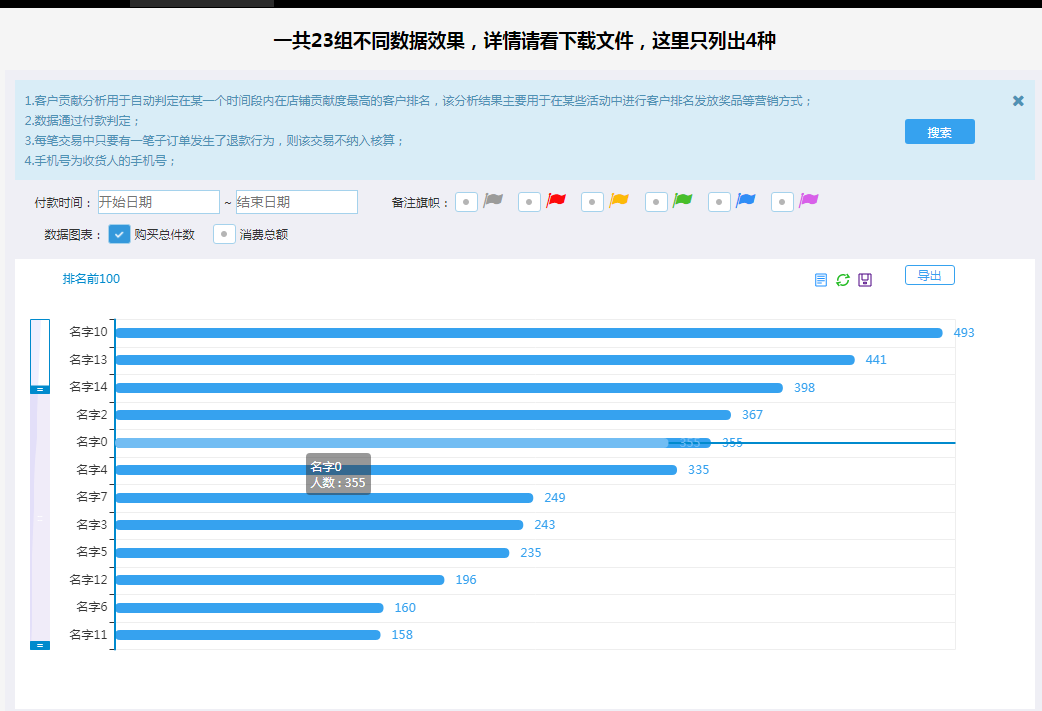
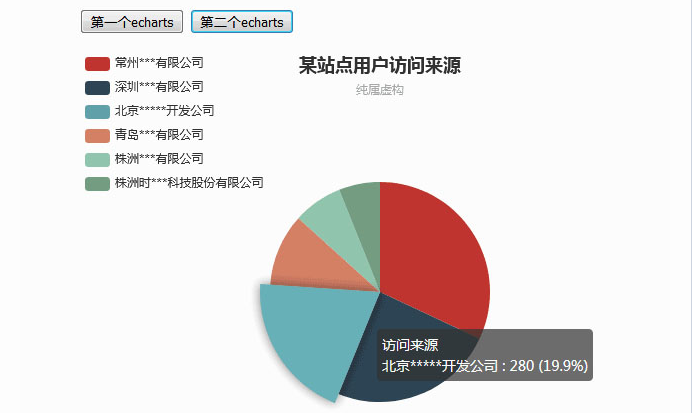
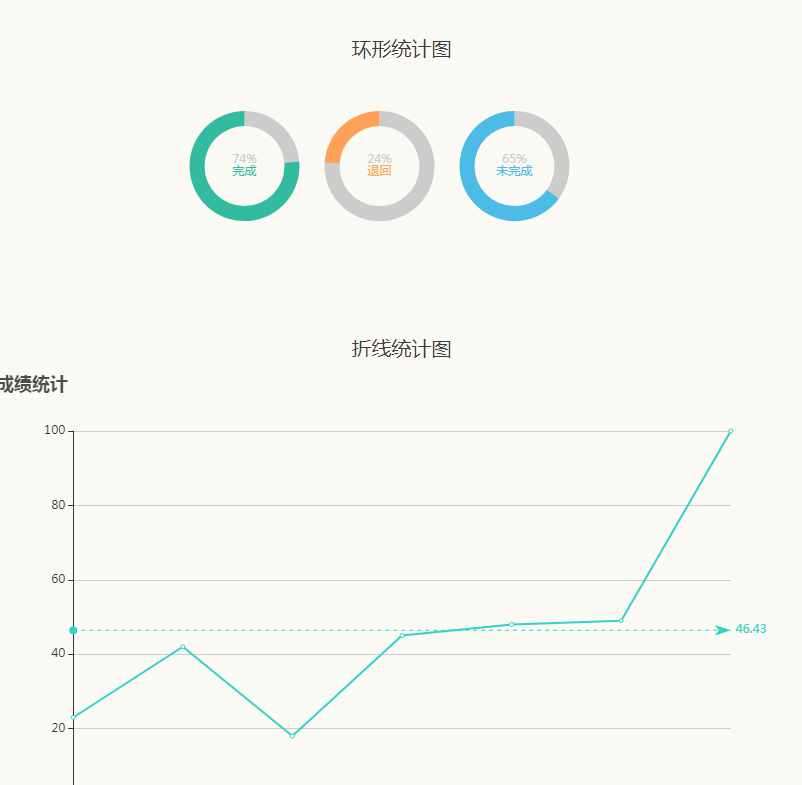
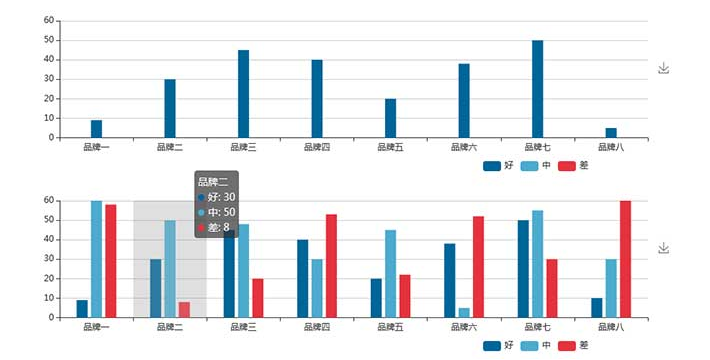
- js-realizes various data analysis, statistical graphics and chart effects commonly used on websites
- Simple and elegant websites commonly use js special effects codes for various data analysis, statistical graphics and charts, including various ring charts, pie charts, line charts, column charts, maps, etc.
- 2018-10-26 390 5523
-

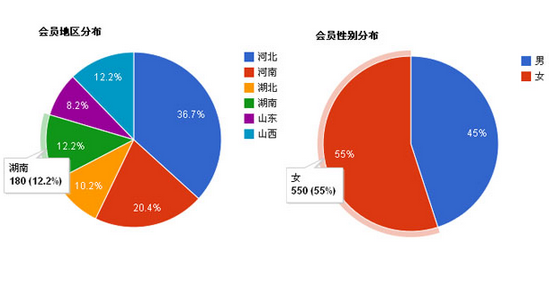
- Practical percentage jQuery pie chart plugin
- It's a pretty good jQuery pie chart plug-in. It's very convenient to load data and output it directly in the table, and then draw a pie chart to show the percentage. When you put the mouse over it, the data with the desired proportion will be displayed. It's still very good, although it doesn't. Highcharts.js is so powerful, at least it is enough for pie charts.
- 2017-01-14 245 3075
-

- jQuery full-screen scrolling operation report chart code
- jQuery full-screen scrolling statistics chart of enterprise operation report data for the current month, including bar chart, pie chart, and curve chart chart statistics code.
- 2019-04-02 138 2515
-

- JS with digital picture switching effects
- JS has a digital picture switching effect, which is a mouse click digital picture slide change effect.
- 2017-08-17 243 1612
-

- Tab label picture switching large picture preview special effect
- Use native js ES6 to implement the category label tab switching display image preview special effects interface. Dynamically set image text acquisition to achieve tab switching effects for classified images. Just call the following function new $isg_Img({data: data, curType: initial display category, parasitifer: locator });
- 2020-11-30 153 1637
-

- jQuery popular city text tag cloud code
- The jQuery popular city text tag cloud code is an enhanced version of the jqcloud city text tag cloud plug-in, which adds mouseover mouseout events for js data interaction.
- 2017-05-04 208 3410
-

- Beautiful portal album effect special effects JS code
- Beautiful portal website photo album effect special effects JS code, portal website common JS photo album playback special effects, supports left and right button playback, supports viewing of original images, supports JSON data format to transfer data, it is still a very good photo album special effect.
- 2017-01-13 203 2905
-

- jQuery pop-up box beautification plug-in
- Beautified version of custom pop-up box, you can change the style and icon according to project needs
- 2019-09-18 138 1955
-

- jquery mouseover 3D flip effect
- 3D flipping of css3 images can make intelligent judgments based on the different directions of the mouse moving in and out.
- 2019-09-19 124 2773
-

- jQuery+echarts uploads images to generate text tag cloud code
- A very rare jQuery+echarts code for uploading images to generate text tag clouds. Based on the echarts chart plug-in and jQuery, it generates special effects of color text tag clouds based on the image style. Clicking on the tag keyword can also enlarge it.
- 2019-03-13 208 3352
-

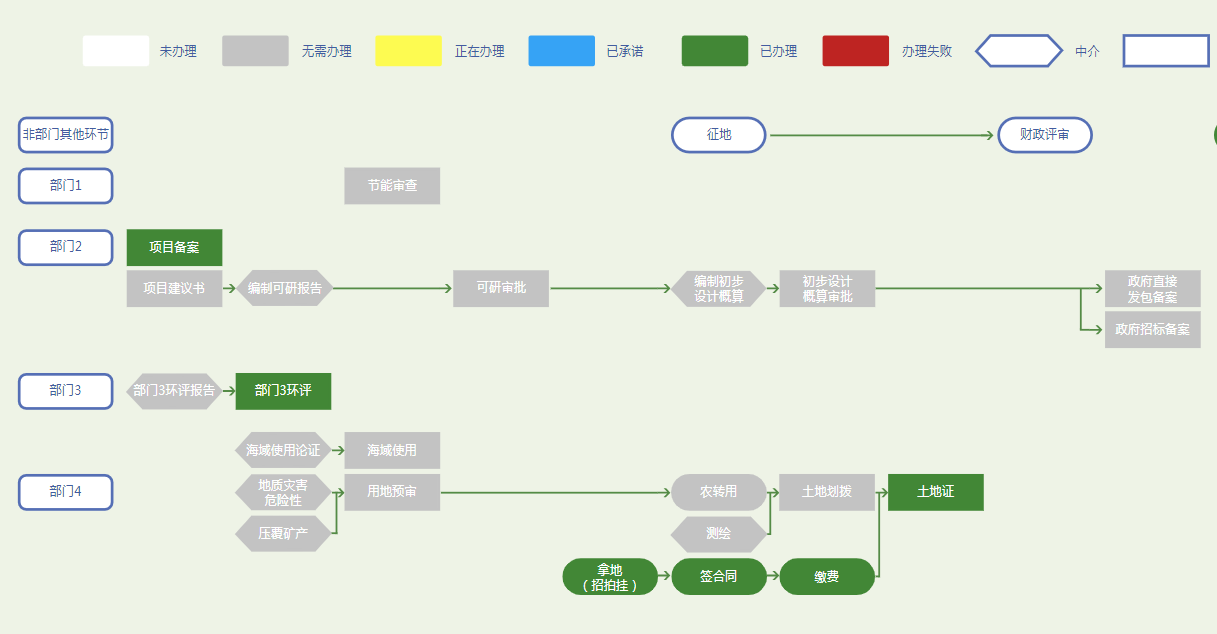
- About the svg jDialog pop-up layer dialog plug-in flow chart
- The jDialog pop-up layer is used in svg. The flow chart presents data that cannot be published. The interface has been slightly changed. The plug-in uses jDialog and has been expanded.
- 2019-09-11 102 1356


