Found a total of 10000 related content
ECharts pie chart (ring): how to display data proportion and structural changes
Article Introduction:ECharts pie chart (ring): how to display data proportions and structural changes ECharts is a JavaScript-based data visualization library that provides a variety of chart types, including line charts, bar charts, scatter charts, maps, etc. Among them, pie charts are a commonly used chart type that can be used to display the proportion and structural changes of data. This article will introduce how to use ECharts pie charts to display data proportions and structural changes, and provide specific code examples. 1. Data format when using ECharts pie chart
2023-12-17
comment 0
1240

How to create beautiful pie charts using Highcharts
Article Introduction:How to use Highcharts to create beautiful pie charts Pie charts are a common way of visualizing data, which can visually show the proportional relationship between different data. Highcharts is a powerful JavaScript chart library that provides a variety of chart types, including pie charts. This article will introduce how to use Highcharts to create beautiful pie charts and provide specific code examples. Step 1: Introduce the Highcharts library First, you need to introduce Hig into the HTML page
2023-12-18
comment 0
769

Databricks releases AI model SDK for big data analysis platform Spark: one-click generation of SQL and FySpark language chart code
Article Introduction:According to news on July 10, Databricks recently released the AI model SDK used by the big data analysis platform Spark. When developers write code, they can give instructions in English, and the compiler will convert the English instructions into PySpark or SQL language codes to improve developers' efficiency. ▲Image source Databricks website It is reported that Spark is an open source big data analysis tool that is downloaded more than 1 billion times a year and is used in 208 countries and regions around the world. ▲Image source Databricks website Databricks said that Microsoft’s AI code assistant GitHubCopilot is powerful, but the threshold for use is also quite high. Databricks’ SDK is relatively more universal and easier to use.
2023-07-17
comment 0
1222

Learn to draw line charts, bar charts and pie charts with Python in three minutes
Article Introduction:Learn to draw line charts, bar charts, and pie charts with Python in three minutes. Python is a very popular programming language that is widely used in data analysis and visualization. In this article, we will learn how to draw three common types of charts using Python: line charts, bar charts, and pie charts. I'll provide you with specific code examples to help you get started quickly. Line Chart A line chart is a type of chart that shows trend changes by connecting data points. In Python, we can use the matplotlib library to plot
2023-09-27
comment 0
1309

Implementation of linear and pie chart functions in Vue statistical charts
Article Introduction:The linear and pie chart functions of Vue statistical charts are implemented in the field of data analysis and visualization. Statistical charts are a very commonly used tool. As a popular JavaScript framework, Vue provides convenient methods to implement various functions, including the display and interaction of statistical charts. This article will introduce how to use Vue to implement linear and pie chart functions, and provide corresponding code examples. Linear graph function implementation A linear graph is a type of chart used to display trends and changes in data. In Vue, we can use some excellent
2023-08-19
comment 0
1058

ECharts pie chart: how to display data proportions
Article Introduction:With the widespread application of data visualization, ECharts, an excellent visualization library, has also received more and more attention. Among them, pie charts are widely used to display the proportion of data. This article will introduce how to use ECharts pie charts to display data proportions and provide specific code examples. 1. Basic concepts of ECharts pie charts First, we need to understand the basic concepts of pie charts. Pie charts are often used to represent the proportion of data. Specific values are converted into angle sizes, and then represented by the size of the sector area. The size of each sector area
2023-12-17
comment 0
1617

ECharts and golang tutorial: Practical tips for making multi-category statistical charts
Article Introduction:ECharts and golang tutorial: Practical tips for making multi-category statistical charts, specific code examples are required In terms of data visualization, charts are very practical. ECharts is a powerful open source visualization chart library, and golang is an efficient programming language that can be used for data analysis and chart production. This article will introduce how to use ECharts and golang to create various types of charts, including line charts, bar charts, scatter charts, pie charts, etc. Line chart A line chart is a classic statistical chart
2023-12-17
comment 0
695

How to use maps to display data in ECharts
Article Introduction:How to use maps to display data in ECharts ECharts is a powerful data visualization tool that supports a variety of chart types, including line charts, bar charts, pie charts, etc. Among them, map charts are an important component in ECharts and can be used to display the data distribution in various regions. This article will introduce how to use the map function in ECharts and give detailed code examples. Before starting, we need to prepare the following files: echarts.min.js: EChar
2023-12-18
comment 0
1595

How to use Highcharts to achieve multiple effects of data visualization
Article Introduction:How to use Highcharts to achieve various effects of data visualization. Data visualization is to display data graphically in order to more intuitively understand the trends and relationships of the data. Highcharts is a powerful JavaScript chart library that can achieve various data visualization effects, including line charts, bar charts, pie charts, scatter charts, etc. This article will introduce how to use Highcharts to achieve several common data visualization effects and provide specific code examples. Line chart Commonly used line chart
2023-12-18
comment 0
577

How to use calendar charts to display time data in ECharts
Article Introduction:How to use calendar charts to display time data in ECharts ECharts (Baidu’s open source JavaScript chart library) is a powerful and easy-to-use data visualization tool. It offers a variety of chart types, including line charts, bar charts, pie charts, and more. The calendar chart is a very distinctive and practical chart type in ECharts, which can be used to display time-related data. This article will introduce how to use calendar charts in ECharts and provide specific code examples. First, you need to use
2023-12-18
comment 0
1643

How to use matplotlib for data visualization
Article Introduction:How to use matplotlib for data visualization Data visualization is an indispensable part of data analysis. The matplotlib library is one of the widely used data visualization tools in Python. This article will introduce how to use matplotlib for data visualization and give some code examples. matplotlib is a powerful, flexible and diverse drawing library that can draw various types of charts, such as line charts, bar charts, scatter charts, pie charts, etc. We can use matpl
2023-08-04
comment 0
1864

ECharts and Java interface: How to quickly implement statistical charts such as line charts, bar charts, pie charts, etc.
Article Introduction:ECharts and Java interface: How to quickly implement statistical charts such as line charts, bar charts, and pie charts. Specific code examples are required. With the advent of the Internet era, data analysis has become more and more important. Statistical charts are a very intuitive and powerful display method. Charts can display data more clearly, allowing people to better understand the connotation and patterns of the data. In Java development, we can use ECharts and Java interfaces to quickly display various statistical charts. ECharts is a software developed by Baidu
2023-12-17
comment 0
1603

Cheats and methods for drawing charts with Python
Article Introduction:Tips and methods for drawing charts with Python, requiring specific code examples Summary: Python is a powerful and easy-to-use programming language, which has rich data processing and graphic display functions. This article will introduce commonly used tips and methods for drawing charts in Python, including the use of matplotlib and seaborn, two commonly used data visualization libraries, as well as specific code examples for drawing common line graphs, scatter plots, histograms and pie charts. 1. Draw a line graph. First, we need to import mat
2023-09-29
comment 0
1501

How to draw a bubble chart using ECharts in Python
Article Introduction:How to use ECharts to draw bubble charts in Python ECharts is a data visualization library based on JavaScript. It provides a variety of chart types, including bar charts, line charts, pie charts, etc. In ECharts, bubble chart is a commonly used chart type, which can show the distribution of data through dots of different sizes. This article will introduce in detail how to use ECharts to draw bubble charts in Python and provide specific code examples. Step 1: Install necessary libraries and
2023-12-17
comment 0
1803
Use ECharts and golang to create diverse statistical charts
Article Introduction:Use ECharts and Golang to create diverse statistical charts Summary: This article introduces how to use ECharts and Golang to create diverse statistical charts. By combining the powerful data visualization capabilities of ECharts and the efficient processing capabilities of Golang, we can easily create various types of statistical charts. This article will use specific code examples to demonstrate how to use ECharts and Golang to implement bar charts, line charts, and pie charts. 1. Background and introduction Statistical charts are data analysis
2023-12-17
comment 0
583
ECharts Getting Started Guide: How to Use ECharts
Article Introduction:ECharts Getting Started Guide: How to use ECharts, specific code examples are required. ECharts is a JavaScript-based data visualization library. By using ECharts, users can easily display a variety of charts, such as line charts, bar charts, pie charts, etc. . This article will introduce you to how to use ECharts and provide detailed code examples. Installing ECharts To use ECharts, you first need to install it. You can download it from ECharts official website htt
2023-12-17
comment 0
924
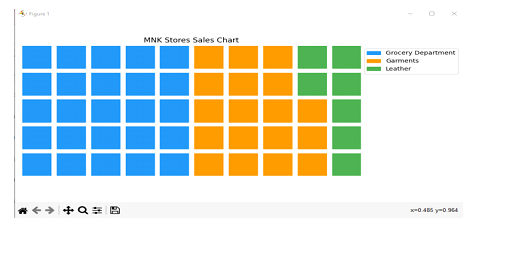
Generate a waffle chart using pyWaffle in Python
Article Introduction:Data visualization is essential for efficient information understanding and presentation. Among the many chart types available, waffle charts are a novel way of displaying data in a grid-like structure with square tiles. The powerful Python module PyWaffle facilitates the development of waffle charts, similar to many computational and data analysis methods. In this article, we will look at how to create a waffle chart using the sophisticated Python module PyWaffle. Let’s install PyWafle and see how to use it to visualize categorical data. Run the following command in your cmd to install the library and then import it into your code. The Chinese translation of pipinstallpywaffleExample1 is: Example 1 In this example, we
2023-08-17
comment 0
1322

How to use stacked charts to display data in ECharts
Article Introduction:ECharts is a very popular visualization library that provides a variety of chart types, including line charts, bar charts, scatter charts, pie charts, and more. Stacked charts are one of the very practical chart types that can help us combine values from different data together according to certain rules and visually display their relative sizes and trends. This article will introduce how to use stacked charts to display data in ECharts and give specific code examples. 1. Prerequisite knowledge Before using ECharts to make stacked charts, we need to master
2023-12-18
comment 0
1468

ECharts histogram (horizontal): how to display data ranking
Article Introduction:ECharts histogram (horizontal): How to display data rankings requires specific code examples. In data visualization, histogram is a commonly used chart type, which can visually display the size and relative relationship of data. ECharts is an excellent data visualization tool that provides developers with rich chart types and powerful configuration options. This article will introduce how to use the histogram (horizontal) in ECharts to display data rankings, and give specific code examples. First, we need to prepare a data containing ranking data
2023-12-17
comment 0
1503

Implementation of pie chart and radar chart functions in Vue statistical charts
Article Introduction:Implementation of the pie chart and radar chart functions of Vue statistical charts Introduction: With the development of the Internet, the demand for data analysis and chart display is becoming more and more urgent. As a popular JavaScript framework, Vue provides a wealth of data visualization plug-ins and components to facilitate developers to quickly implement various statistical charts. This article will introduce how to use Vue to implement the functions of pie charts and radar charts, and provide relevant code examples. Introducing statistical chart plug-ins In Vue development, we can use some excellent statistical chart plug-ins to help us implement
2023-08-18
comment 0
1635


