


This article mainly introduces the methods and steps of local breakpoint debugging of PhpStorm. It has certain reference value. Now I share it with everyone. Friends in need can refer to it.
When debugging PHP code, often Use print_r or var_dump to set breakpoints, but when the project is more complex, this is very inefficient. Breakpoint debugging solves this problem very well. This article mainly introduces the method of local breakpoint debugging in PhpStorm. Steps, interested friends can refer to
Preface:
When debugging PHP code, it is often print_r or Use var_dump to breakpoint, but when the project is more complex, this is very inefficient. Breakpoint debugging solves this problem very well. You may not be comfortable with breakpoint debugging at first, but once you get used to it, the more you use it, the more comfortable you will become.
Note: The following is in the windows7 apache environment
1. Breakpoint debugging php environment setup
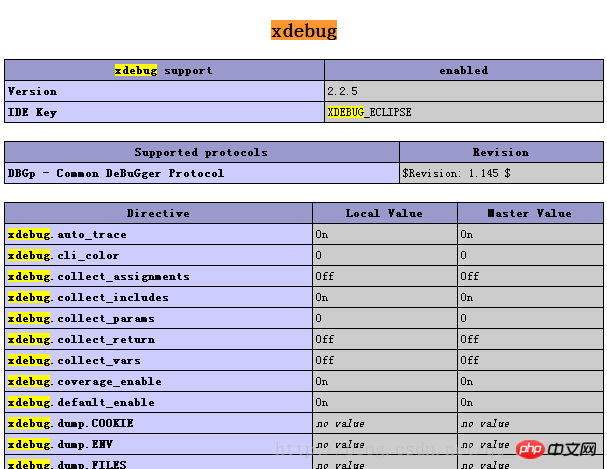
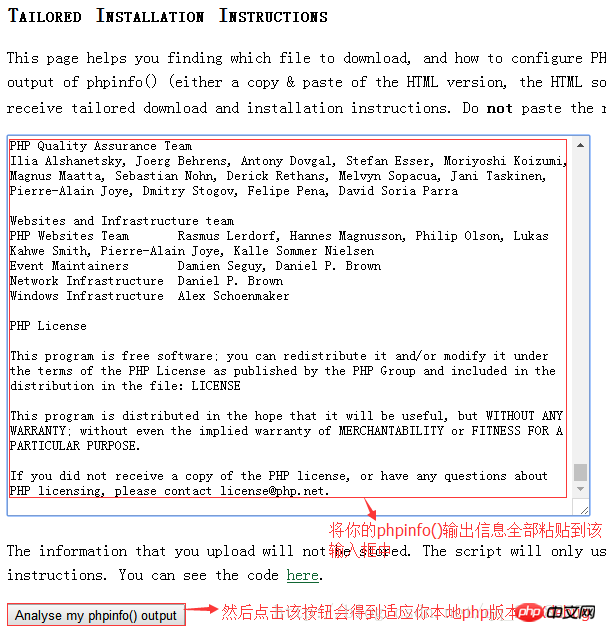
1. Detect local Whether Xdebug is installed in the php environment
Output phpinfo() locally; search for Xdebug; as shown below
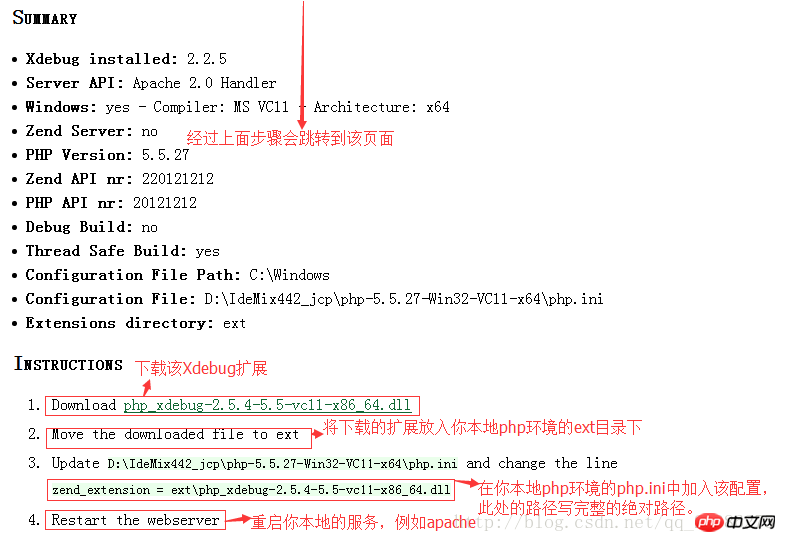
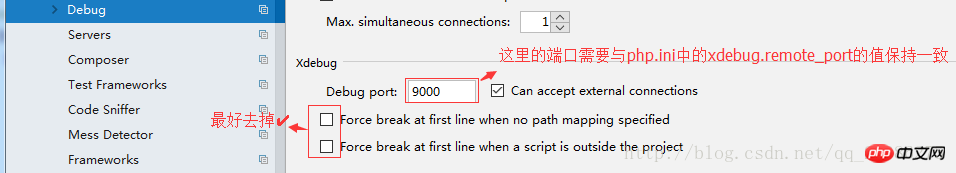
[xdebug] ;zend_extension的值根据自己的本地环境填写 zend_extension = "D:/IdeMix442_jcp/php-5.5.27-Win32-VC11-x64/ext/php_xdebug-2.2.5-5.5-vc11-x86_64.dll" xdebug.idekey=phpstorm xdebug.remote_enable = On xdebug.remote_host=localhost ;xdebug.remote_port默认值为9000,这里需要跟phpstorm配置一致,下面有说明 xdebug.remote_port=9000 xdebug.remote_handler=dbgp xdebug.auto_trace = On
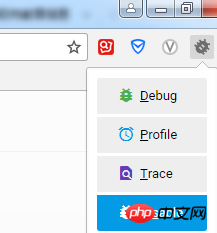
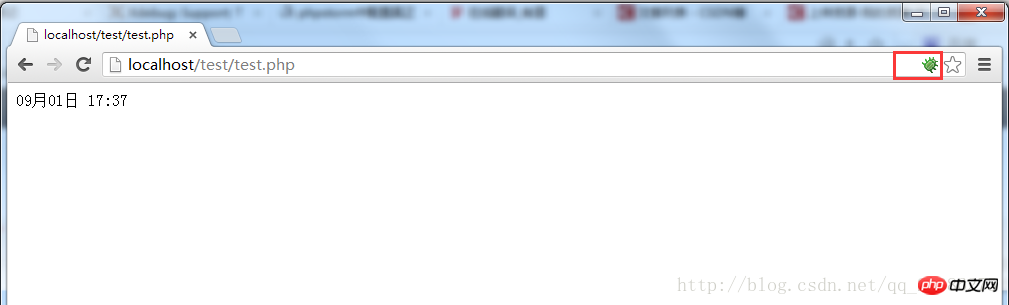
##2. Start your breakpoint debugging1. In your browser with the Xdebug extension installed, open a page of your local project. And turn on debug in the upper right corner of the browser, as shown below.
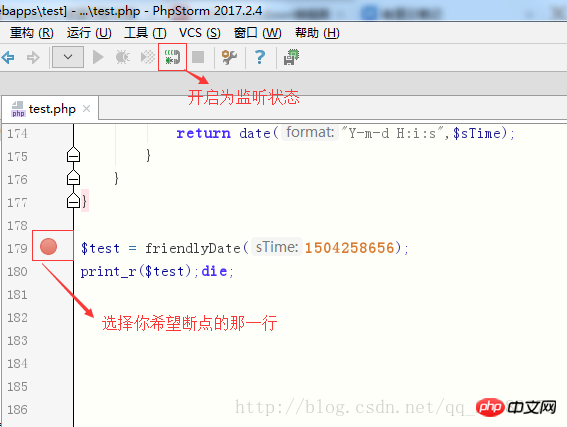
2. In your phpstorm editor, open the code you want to go through on the page in the browser, and operate as shown below.
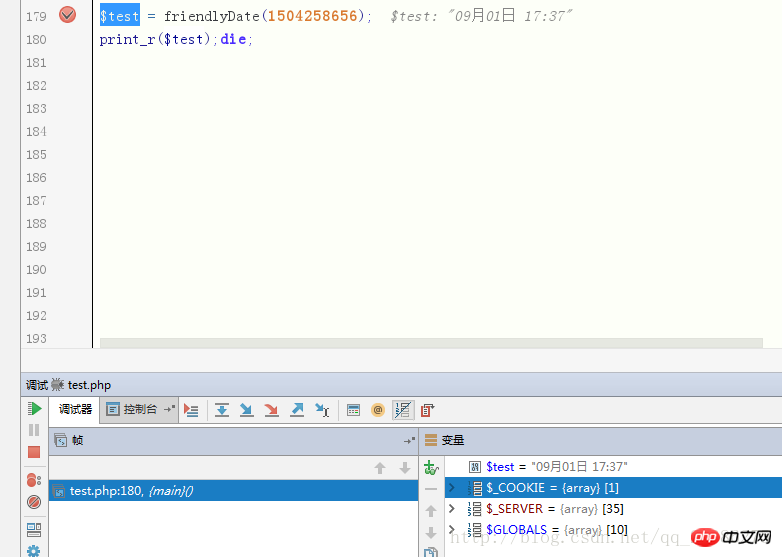
3. Refresh the page you opened in the browser again, and then look at your phpstorm editor. The red circle at the breakpoint on the left changes to a check mark in the circle, which means you have entered the breakpoint. As shown below
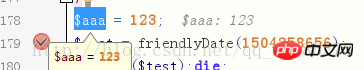
3. Some simple operations for breakpoint debugging1. View The values of some variables before your breakpoint
Double-click the variable you want to view, and the value will appear when the mouse stays on it. Or right-click after selecting it and select Add to Watch (the English version is add to watch), as shown below
## 2. From where your breakpoint starts, you can press F7, and the program will go down step by step. If it encounters a function, it will jump to that function; press F8 to go down line by line in the current code page. It will not jump when it encounters a function. These two functions are the most practical and key functions of breakpoint debugging.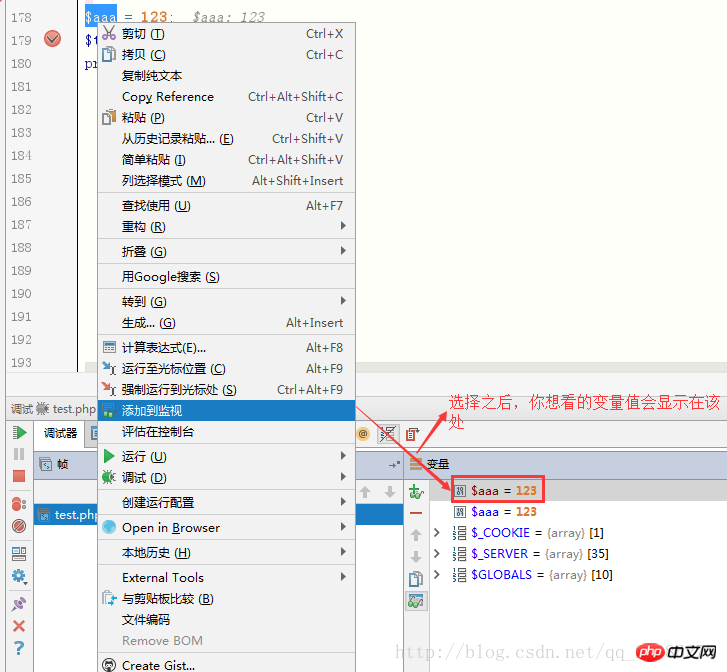
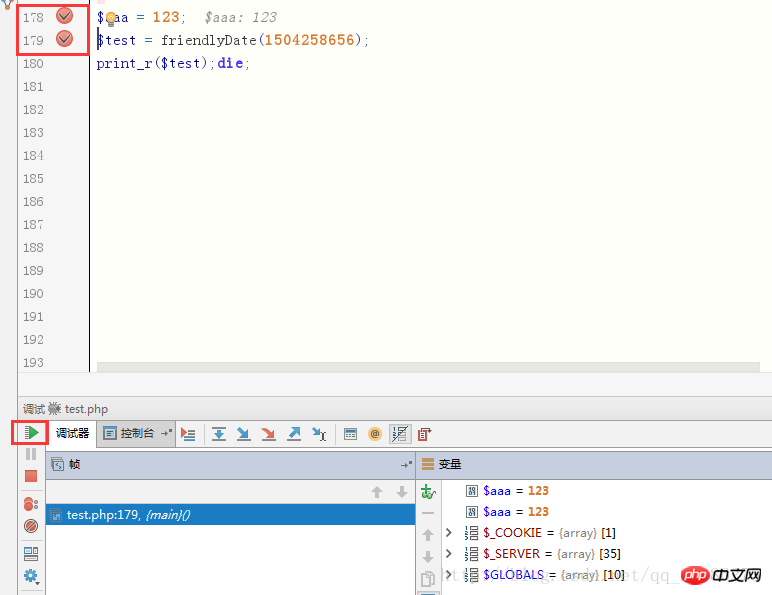
3. When you want to jump directly from a breakpoint to a breakpoint on another line, you can enter the breakpoint, click on the breakpoint where you want to breakpoint on another line, and then press F9 or Click the green button in the lower border, as shown below.
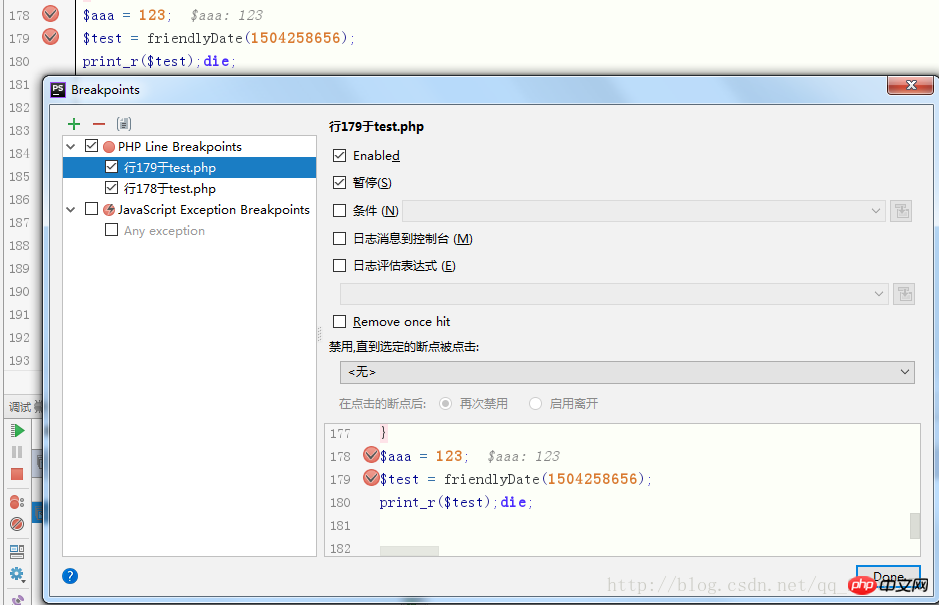
4. When you breakpoint in multiple places due to breakpoint debugging, and open multiple files, and want to check where you brokepointed, you can Press Ctrl Shift F8 to browse breakpoints
5. There are many tips for breakpoint debugging, which you can slowly discover and explore during use.
Related recommendations:
PHP MariaDB database operation basic skills memo summary
##
The above is the detailed content of PhpStorm local breakpoint debugging method steps. For more information, please follow other related articles on the PHP Chinese website!


![[Web front-end] Node.js quick start](https://img.php.cn/upload/course/000/000/067/662b5d34ba7c0227.png)


