


This article mainly introduces the wampserver phpstorm xdebug environment configuration and debugging php code. It has a certain reference value. Now I share it with you. Friends in need can refer to it
wampserver installation
##phpstorm installation
xdebug installation
Debugging under phpstorm
Wampserver installation is relatively simple, you only need to download wampserver.exe and continue all the wayphpstorm installation
phpstorm download address: https ://www.jetbrains.com/phpstorm/xdebug installationphpstorm cracking method: http://www.oyksoft.com/soft/40722.html?pc=1
After the installation is complete, if phpstorm still does not crack correctly, check to see if your host file has 0.0.0.0 account.jetbrains.com added to it. The specific host file storage location is: C:\Windows\System32\drivers\ etc
By default, if you install wampserver, the xdebug plug-in is installed by default. The specific xdebug installation path can be viewed in php.ini Find it. The way to find it is to left-click the wampserver program icon, find the PHP option, find php.ini, click in, and search for [xdebug]. The value of zend_extension is your xdebug storage location. In order to be able to debug the php code in phpstorm, we You need to add the following code at the end of the [xdebug] tag in php.ini:zend_extension ="E:/StudySoftware/wampserver/wamp/bin/php/php5.6.25/zend_ext/php_xdebug-2.4.1-5.6-vc11.dll"xdebug.remote_enable = 1xdebug.profiler_enable = off xdebug.profiler_enable_trigger = Off xdebug.profiler_output_name = cachegrind.out.%t.%p xdebug.profiler_output_dir ="E:/StudySoftware/wampserver/wamp/tmp"xdebug.show_local_vars=0xdebug.idekey=PhpStorm xdebug.remote_enable = On xdebug.remote_host=localhost xdebug.remote_port=9000 xdebug.remote_handler=dbgpCopy after login
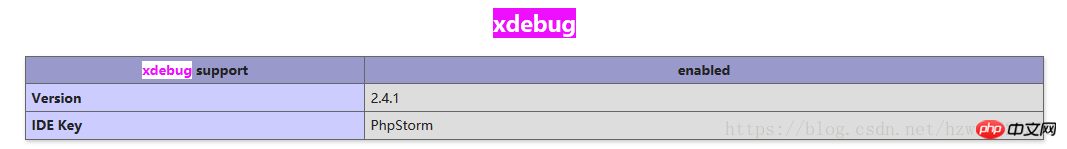
After the configuration is completed, restart wampserver, then enter localhost in the browser, find phpinfo, and click in , search for xdebug and find the following content:Install the Xdebug plug-in under Google Chrome
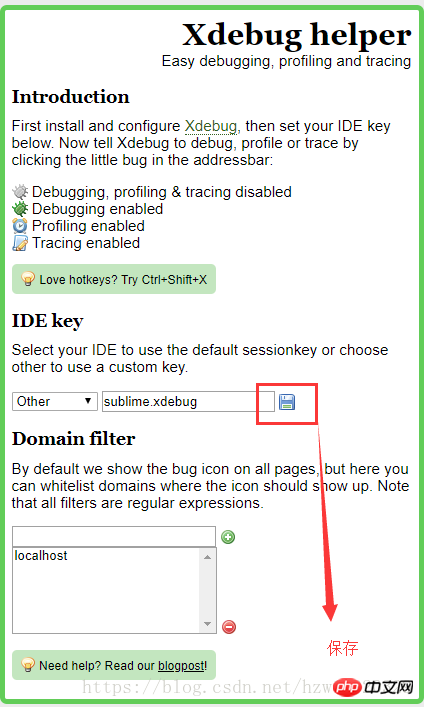
Download address: http://www.downza. cn/soft/211550.htmlphpstorm debugging configurationAfter the download is complete, click the spider icon in the upper right corner, select options, and enter the content as shown below
(1): File->Settings->Languages&Frame Works->Php->Servers Configure server-related settings. The configuration content is as shown in the figure belowphpstorm for debugging
(2): File->Settings->Languages&Frame Works->Php->Debug->DBGp Proxy configuration related settings, the configuration content is as shown below:
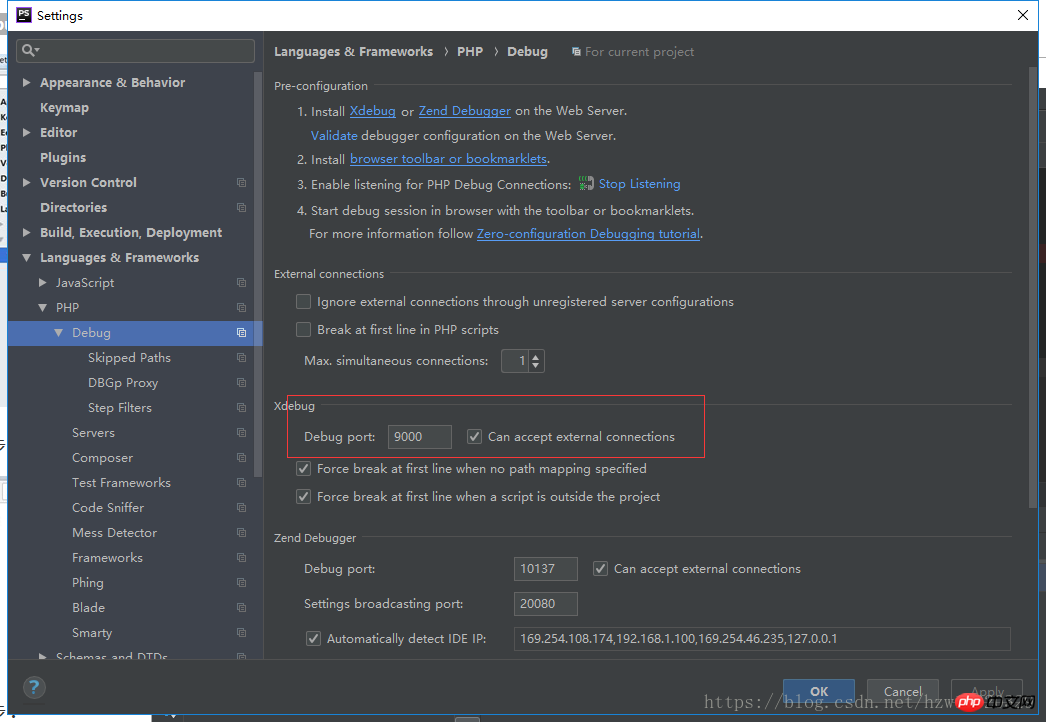
(3): File->Settings->Languages&Frame Works->Php-Debug Find the debug settings corresponding to the window on the right, change the port to 9000, and the configuration content is as shown below:
(1): Enter: http://localhost/startwill/index.php in Google Chrome. Of course, you can change this address at willReference(2): Click on the xdebug plug-in in Google Chrome and select the Debug option
(3): Open one of our own php files in phpstorm, here mine is the index.php file, set a breakpoint, and click the debug button in the upper right corner:
(4): After pressing the Enter key in the browser, it will execute to the breakpoint we set
http://developer.51cto.com/art/201704/536857.htm
The above is the detailed content of wampserver+phpstorm+xdebug environment configuration debugging php code. For more information, please follow other related articles on the PHP Chinese website!


![[Web front-end] Node.js quick start](https://img.php.cn/upload/course/000/000/067/662b5d34ba7c0227.png)


