


Snowflake telah mengeluarkan ciri pembantu LLM yang dipanggil Snowflake Copilot sebagai ciri pratonton. Dengan Snowflake Copilot, anda boleh menganalisis data jadual menggunakan bahasa semula jadi.
Sebaliknya, Streamlit in Snowflake (SiS) membolehkan anda dengan mudah menggabungkan AI generatif dan mengakses data jadual dengan selamat. Ini membuatkan saya berfikir: bolehkah kita mencipta alat analisis data bahasa semula jadi yang lebih proaktif? Jadi, saya membangunkan apl yang boleh menganalisis dan menggambarkan data menggunakan bahasa semula jadi.
Nota: Catatan ini mewakili pandangan peribadi saya dan bukan pandangan Snowflake.
Berikut adalah petikan daripada keputusan analisis menggunakan Cortex LLM (snowflake-arctic).
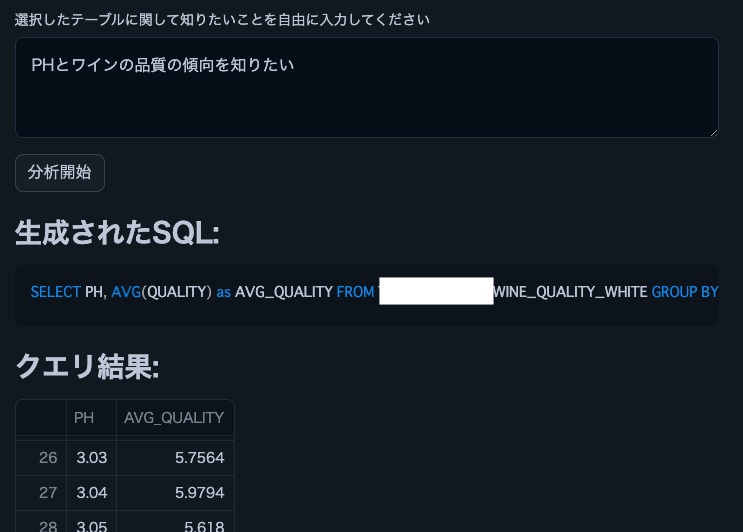
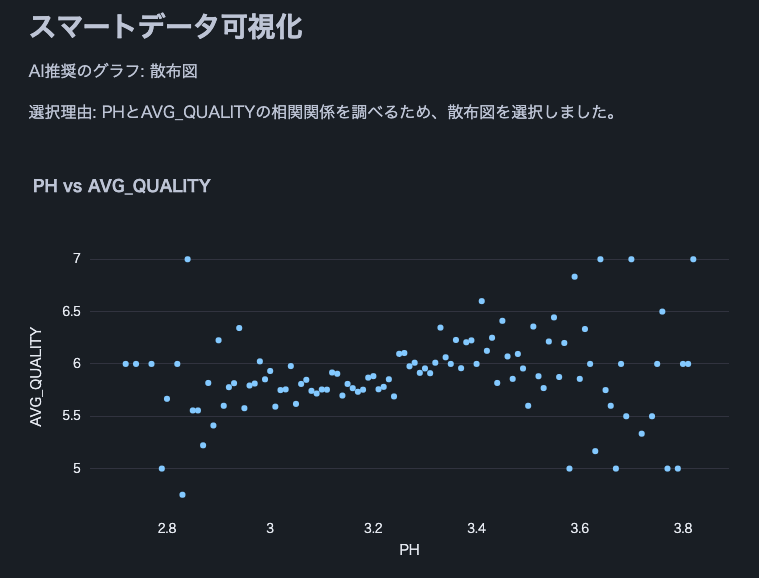

Nota: Kami menggunakan set data kualiti wain ini.
from snowflake.snowpark.context import get_active_session import streamlit as st from snowflake.cortex import Complete as CompleteText import snowflake.snowpark.functions as F import pandas as pd import numpy as np import json import plotly.express as px # Get current session session = get_active_session() # Application title st.title("Natural Language Data Analysis App") # Cortex LLM settings st.sidebar.title("Cortex LLM Settings") lang_model = st.sidebar.radio("Select the language model you want to use", ("snowflake-arctic", "reka-flash", "reka-core", "mistral-large2", "mistral-large", "mixtral-8x7b", "mistral-7b", "llama3.1-405b", "llama3.1-70b", "llama3.1-8b", "llama3-70b", "llama3-8b", "llama2-70b-chat", "jamba-instruct", "gemma-7b") ) # Function to escape column names def escape_column_name(name): return f'"{name}"' # Function to get table information def get_table_info(database, schema, table): # Get column information columns = session.sql(f"DESCRIBE TABLE {database}.{schema}.{table}").collect() # Create DataFrame column_df = pd.DataFrame(columns) # Get row count row_count = session.sql(f"SELECT COUNT(*) as count FROM {database}.{schema}.{table}").collect()[0]['COUNT'] # Get sample data sample_data = session.sql(f"SELECT * FROM {database}.{schema}.{table} LIMIT 5").collect() sample_df = pd.DataFrame(sample_data) return column_df, row_count, sample_df # Data analysis function def analyze(df, query): st.subheader("Result Analysis") # Display basic statistical information st.subheader("Basic Statistics") st.write(df.describe()) # Use AI for data analysis analysis_prompt = f""" Based on the following dataframe and original question, please perform data analysis. Concisely explain in English the insights, trends, and anomalies derived from the data. If possible, please also mention the following points: 1. Data distribution and characteristics 2. Presence of abnormal values or outliers 3. Correlations between columns (if there are multiple numeric columns) 4. Time-series trends (if there is date or time data) 5. Category-specific features (if data can be divided by categories) Dataframe: {df.to_string()} Original question: {query} """ analysis = CompleteText(lang_model, analysis_prompt) st.write(analysis) # Data visualization function def smart_data_visualization(df): st.subheader("Smart Data Visualization") if df.empty: st.warning("The dataframe is empty. There is no data to visualize.") return # Request AI for graph suggestion columns_info = "\n".join([f"{col} - type: {df[col].dtype}" for col in df.columns]) sample_data = df.head().to_string() visualization_prompt = f""" Analyze the information of the following dataframe and suggest the most appropriate graph type and the columns to use for its x-axis and y-axis. Consider the characteristics of the data to ensure a meaningful visualization. Column information: {columns_info} Sample data: {sample_data} Please provide only the following JSON data format as your response: {{ "graph_type": "One of: scatter plot, bar chart, line chart, histogram, box plot", "x_axis": "Column name to use for x-axis", "y_axis": "Column name to use for y-axis (if applicable)", "explanation": "Brief explanation of the selection reason" }} """ ai_suggestion = CompleteText(lang_model, visualization_prompt) try: suggestion = json.loads(ai_suggestion) graph_type = suggestion['graph_type'] x_axis = suggestion['x_axis'] y_axis = suggestion.get('y_axis') # y-axis might not be needed in some cases explanation = suggestion['explanation'] st.write(f"AI recommended graph: {graph_type}") st.write(f"Selection reason: {explanation}") if graph_type == "scatter plot": fig = px.scatter(df, x=x_axis, y=y_axis, title=f"{x_axis} vs {y_axis}") elif graph_type == "bar chart": fig = px.bar(df, x=x_axis, y=y_axis, title=f"{y_axis} by {x_axis}") elif graph_type == "line chart": fig = px.line(df, x=x_axis, y=y_axis, title=f"{y_axis} over {x_axis}") elif graph_type == "histogram": fig = px.histogram(df, x=x_axis, title=f"Distribution of {x_axis}") elif graph_type == "box plot": fig = px.box(df, x=x_axis, y=y_axis, title=f"Distribution of {y_axis} by {x_axis}") else: st.warning(f"Unsupported graph type: {graph_type}") return st.plotly_chart(fig) except json.JSONDecodeError: st.error("Failed to parse AI suggestion. Please try again.") except KeyError as e: st.error(f"AI suggestion is missing necessary information: {str(e)}") except Exception as e: st.error(f"An error occurred while creating the graph: {str(e)}") # AI interpretation of visualization visualization_interpretation_prompt = f""" Based on the following dataset and created graph, please provide a detailed interpretation of the data trends and characteristics in English. Point out possible insights, patterns, anomalies, or areas that require additional analysis. Dataset information: Columns: {', '.join(df.columns)} Number of rows: {len(df)} Created graph: Type: {graph_type} X-axis: {x_axis} Y-axis: {y_axis if y_axis else 'None'} """ ai_interpretation = CompleteText(lang_model, visualization_interpretation_prompt) st.subheader("AI Interpretation of the Graph") st.write(ai_interpretation) # Function to handle cases where AI response is not just SQL query def clean_sql_query(query): # Remove leading and trailing whitespace query = query.strip() # If not starting with SQL keywords, remove everything up to the first SELECT if not query.upper().startswith(('SELECT')): keywords = ['SELECT'] for keyword in keywords: if keyword in query.upper(): query = query[query.upper().index(keyword):] break return query # Function for natural language querying of DB def data_analysis_and_natural_language_query(): # Database selection databases = session.sql("SHOW DATABASES").collect() database_names = [row['name'] for row in databases] selected_database = st.selectbox("Select a database", database_names) if selected_database: # Schema selection schemas = session.sql(f"SHOW SCHEMAS IN DATABASE {selected_database}").collect() schema_names = [row['name'] for row in schemas] selected_schema = st.selectbox("Select a schema", schema_names) if selected_schema: # Table selection tables = session.sql(f"SHOW TABLES IN {selected_database}.{selected_schema}").collect() table_names = [row['name'] for row in tables] selected_table = st.selectbox("Select a table", table_names) if selected_table: # Get table information column_df, row_count, sample_df = get_table_info(selected_database, selected_schema, selected_table) st.subheader("Table Information") st.write(f"Table name: `{selected_database}.{selected_schema}.{selected_table}`") st.write(f"Total rows: **{row_count:,}**") st.subheader("Column Information") st.dataframe(column_df) st.subheader("Sample Data (showing only 5 rows)") st.dataframe(sample_df) # Stringify table information (for AI) table_info = f""" Table name: {selected_database}.{selected_schema}.{selected_table} Total rows: {row_count} Column information: {column_df.to_string(index=False)} Sample data: {sample_df.to_string(index=False)} """ # Natural language input from user user_query = st.text_area("Enter what you want to know about the selected table") if st.button("Start Analysis"): if user_query: # Use AI to generate SQL prompt = f""" Based on the following table information and question, please generate an appropriate SQL query. Return only the generated SQL query without any additional response. Table information: {table_info} Question: {user_query} Notes: - Follow Snowflake SQL syntax. - Use aggregate functions to keep the query result size manageable. - Use {selected_database}.{selected_schema}.{selected_table} as the table name. """ generated_sql = CompleteText(lang_model, prompt) generated_sql = clean_sql_query(generated_sql) st.subheader("Generated SQL:") st.code(generated_sql, language='sql') try: # Execute the generated SQL result = session.sql(generated_sql).collect() df = pd.DataFrame(result) st.subheader("Query Result:") st.dataframe(df) # Analyze results analyze(df, user_query) # Smart data visualization smart_data_visualization(df) except Exception as e: st.error(f"An error occurred while executing the query: {str(e)}") else: st.warning("Please enter a question.") # Execution part data_analysis_and_natural_language_query()
Keupayaan untuk menganalisis data jadual dengan mudah menggunakan bahasa semula jadi tanpa pengetahuan SQL atau Python boleh meluaskan skop penggunaan data dalam perusahaan untuk pengguna perniagaan dengan ketara. Dengan menambahkan ciri seperti menyertai berbilang jadual atau meningkatkan kepelbagaian graf visualisasi, analisis yang lebih kompleks boleh dilakukan. Saya menggalakkan semua orang cuba melaksanakan pendemokrasian analisis data menggunakan Streamlit in Snowflake.
Saya berkongsi kemas kini Snowflake's What's New pada X. Sila ikuti jika anda berminat!
Snowflake What's New Bot (Versi Bahasa Inggeris)
https://x.com/snow_new_en
Snowflake What's New Bot (Versi Jepun)
https://x.com/snow_new_jp
(20240914) Catatan awal
https://zenn.dev/tsubasa_tech/articles/2608c820294860
Atas ialah kandungan terperinci Cuba analisis data bahasa semula jadi dengan Streamlit in Snowflake (SiS). Untuk maklumat lanjut, sila ikut artikel berkaitan lain di laman web China PHP!
 Perintah shell yang biasa digunakan dalam Linux
 Cara menggunakan fungsi math.round
 Mengapa pencetak tidak mencetak?
 Bagaimana untuk menyelesaikan masalah akses ditolak semasa boot Windows 10
 Pengenalan kepada penggunaan pelayan ftp
 Apakah maksud aktiviti?
 Kod yang biasa digunakan dalam bahasa html
 Mengapa wifi mempunyai tanda seru?


![[Web front-end] Permulaan pantas Node.js](https://img.php.cn/upload/course/000/000/067/662b5d34ba7c0227.png)


