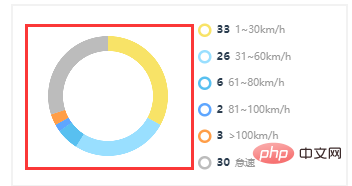
반응 프로젝트에 echarts 원형 차트를 추가하는 방법: 1. "npm install echarts --save" 명령을 통해 "echarts"를 설치합니다. 2. 가져오기를 사용하여 "echarts/lib/echarts"를 도입합니다. {. ..}" 그냥 echarts 원형 차트를 추가하세요.

이 튜토리얼의 운영 환경: Windows 10 시스템, 반응 버전 18.0.0, Dell G3 컴퓨터.
반응 프로젝트에 echarts 원형 차트를 추가하는 방법은 무엇입니까?
React 프로젝트에서 echarts 원형 차트 사용하기
1.
npm install echarts --save
설치 2.
import echarts from 'echarts/lib/echarts';
import  'echarts/lib/chart/pie';  //饼状图
import  'echarts/lib/component/tooltip';
import  'echarts/lib/component/title';
import  'echarts/lib/component/legend'
import  'echarts/lib/component/markPoint'
소개 3. 사용
componentDidMount() {
        //环形图百分比
        var huan_val = document.getElementsByClassName("huan")[0];
        var chart = echarts.init(huan_val);
        let option = {
            color: ["#f8e367", "#99dfff", "#58c0f0", "#5ea6ff", "#ff9e48", "#bcbcbc"],
            series: [{
                name: "驾驶分析",
                type: "pie",
                radius: ['60%', '80%'],
                avoidLabelOverlap: false,
                label: {
                    normal: {
                        show: false,
                        position: 'center'
                    },
                    emphasis: {
                        show: true,
                        textStyle: {
                            fontSize: '30',
                            fontWeight: 'bold'
                        }
                    }
                },
                labelLine: {
                    normal: {
                        show: false
                    }
                },
                data: [{
                    value: 33,
                    name: '慢速'
                }, {
                    value: 26,
                    name: '低速'
                }, {
                    value: 6,
                    name: '中速'
                }, {
                    value: 2,
                    name: '高速'
                }, {
                    value: 3,
                    name: '超速'
                }, {
                    value: 30,
                    name: '怠速'
                }]
            }]
        };
        chart.setOption(option);
}render(){
return(
<div className="huan"></div>
)}4. 결과
추천 학습: "반응 비디오 튜토리얼"
위 내용은 프로젝트 반응에 echarts 원형 차트를 추가하는 방법의 상세 내용입니다. 자세한 내용은 PHP 중국어 웹사이트의 기타 관련 기사를 참조하세요!