seaborn.heatmap(data, vmin=None, vmax=None,cmap=None, center=None, Powerful=False, annot=None, fmt='.2g', annot_kws=없음,linewidths=0, linecolor='white', cbar=True, cbar_kws=없음, cbar_ax=None,square=False, xticklabels='auto', yticklabels='auto', 마스크=None, ax=None, ** kwargs)
data: 행렬 데이터 세트, numpy 배열 또는 pandas DataFrame일 수 있습니다. DataFrame인 경우 df의 인덱스/열 정보는 각각 히트맵의 열과 행에 해당합니다. 즉, pt.index는 히트맵의 행 레이블이고 pt.columns는 열 레이블입니다. 히트 맵
vmax, vmin: 각각 히트 맵의 최대 및 최소 색상 값 범위 기본값은 데이터 테이블
cmap의 값을 기반으로 결정됩니다. : 숫자에서 색상 공간, 값으로 매핑 matplotlib 패키지의 색상 맵 이름 또는 색상 객체이거나 색상을 나타내는 목록입니다. 매개변수의 기본값을 변경합니다. 중앙 매개변수에 따라 설정합니다.
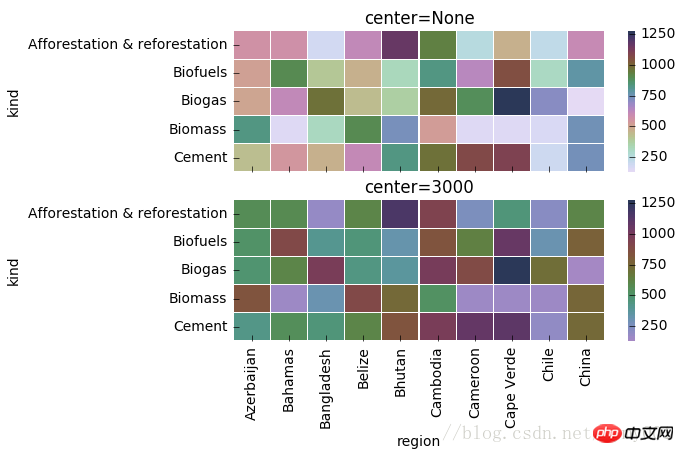
center: 데이터 테이블의 값이 다르면 히트 맵의 색상 중심 정렬 값을 설정합니다. 중심 값을 설정하면 데이터 오버플로가 있는 경우 중심 데이터를 설정할 때 생성된 이미지 색상의 전체 깊이를 조정할 수 있습니다. vmax를 수동으로 설정하면 vmin이 자동으로 변경됩니다
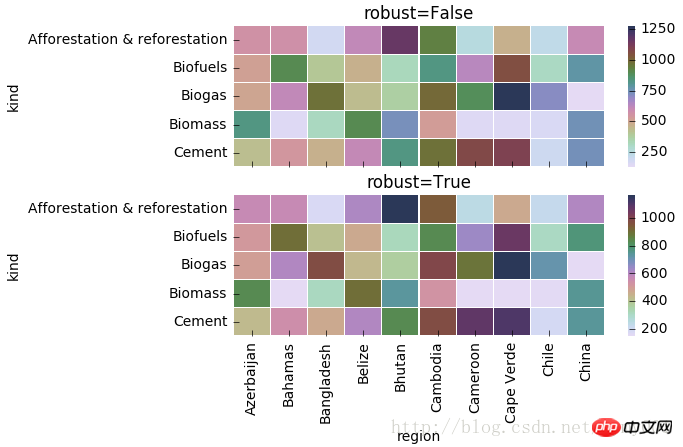
robust: 기본값은 False이고, 값이 없으면 vmin과 vmax의 값을 설정합니다. 히트맵의 색상 매핑 범위가 설정됩니다. 극단적인 값을 사용하는 대신 강력한 분위수에 따라
annot(annotate): 기본값은 True인 경우 False이며, 각 사각형에 데이터가 기록됩니다. 히트맵의 경우 행렬의 해당 위치 데이터가 히트맵의 각 사각형에 기록됩니다
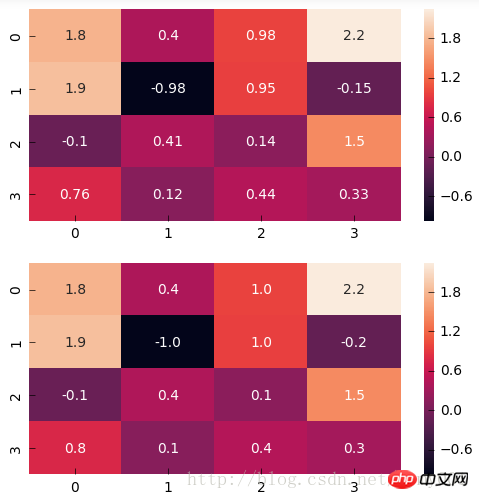
fmt: 문자 문자열 형식 코드, 행렬의 숫자를 식별하기 위한 데이터 형식 소수점 이하 여러 자리 유지
annot_kws: 기본값은 False입니다. True인 경우 matplotlib 패키지 글꼴 설정의 텍스트 클래스 아래에서 히트 맵 행렬의 숫자 크기, 색상 및 글꼴을 설정합니다. 공식 문서:
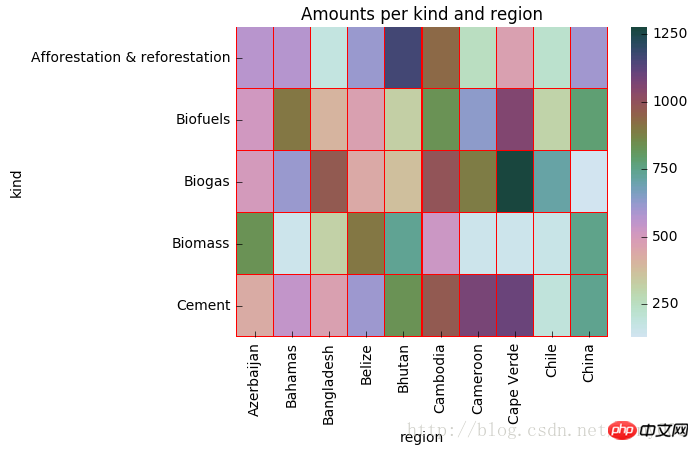
linewidths: 히트 맵에서 "쌍별 특징 관계를 나타내는 행렬 블록" 사이의 간격을 정의합니다.
linecolor: 히트맵의 각 매트릭스 패치를 나누는 선. 기본값은 'white'
cbar: 히트맵 측면에 그릴지 여부 색상 스케일 바, 기본값은 True
cbar_kws: 히트맵 측면에 컬러 스케일 바를 그릴 때 관련 글꼴 설정, 기본값은 None
cbar_ax: 히트맵 측면에 컬러 스케일 바를 그릴 때 지도, 축척 막대 위치 설정, 기본값은 None
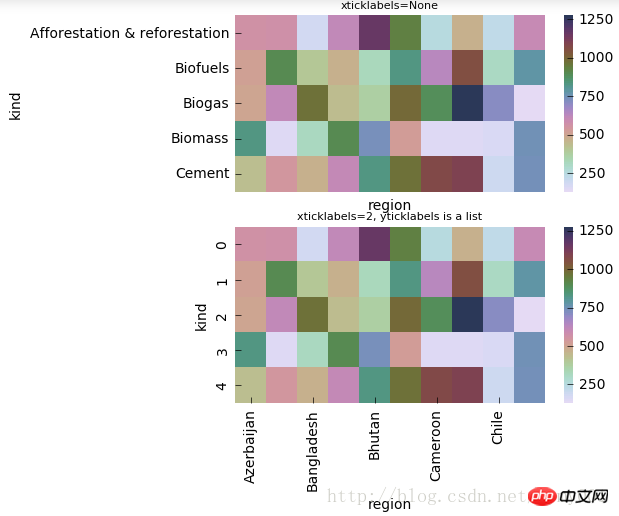
xticklabels, yticklabels:xticklabels가 출력을 제어합니다. 각 열의 레이블 이름 중 yticklabels는 각 행 출력의 레이블 이름 출력을 제어합니다. 기본값은 자동입니다. True이면 DataFrame의 열 이름이 레이블 이름으로 사용됩니다. False인 경우 행 레이블 이름이 추가되지 않습니다. 목록인 경우 레이블 이름은 목록에 지정된 내용으로 변경됩니다. 정수 K인 경우 그래프의 K개 레이블마다 레이블을 지정합니다. 자동인 경우 라벨의 라벨 간격이 자동으로 선택되고 라벨 이름이 겹치지 않는 부분(또는 전체)이 출력됩니다.
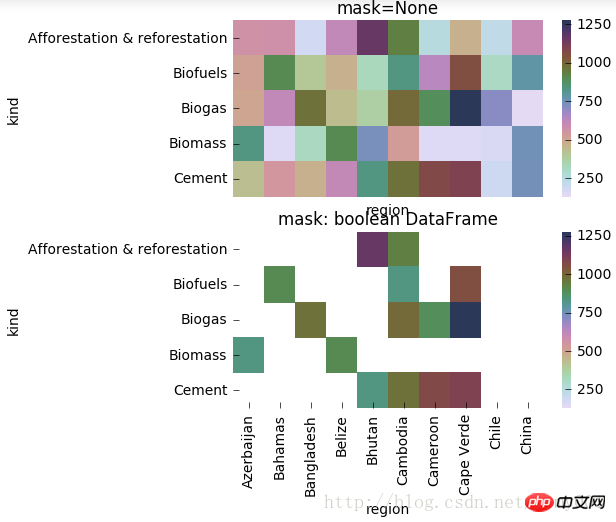
mask: 특정 매트릭스 블록의 표시 여부를 제어합니다. 기본값은 없음입니다. Boolean DataFrame인 경우 DataFrame의 실제 위치를 흰색
ax으로 덮습니다. 도면의 좌표축을 설정합니다. 일반적으로 여러 하위 그래프를 그릴 때 서로 다른 하위 그래프의 값을 수정해야 합니다
**kwargs :다른 모든 키워드 인수는 ax.pcolormesh
#cmap(颜色)

import matplotlib.pyplot as plt
% matplotlib inline

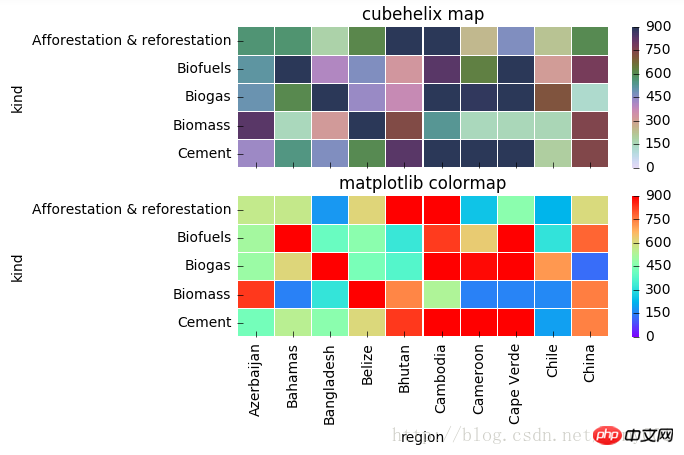
f, (ax1,ax2) = plt.subplots(figsize = (6,4),nrows=2)

# cmap用cubehelix map颜色
cmap = sns.cubehelix_palette(start = 1.5, rot = 3, gamma=0.8, as_cmap = True)
sns.heatmap(pt, linewidths = 0.05, ax = ax1, vmax=900, vmin=0, cmap=cmap)
ax1.set_title('cubehelix map')
ax1.set_xlabel('')
ax1.set_xticklabels([]) #设置x轴图例为空值
ax1.set_ylabel('kind')

# cmap用matplotlib colormap
sns.heatmap(pt, linewidths = 0.05, ax = ax2, vmax=900, vmin=0, cmap='rainbow')
# rainbow为 matplotlib 的colormap名称
ax2.set_title('matplotlib colormap')
ax2.set_xlabel('region')
ax2.set_ylabel('kind')
#center的用法(颜色)f, (ax1,ax2) = plt.subplots(figsize = (6, 4),nrows=2)

cmap = sns.cubehelix_palette(start = 1.5, rot = 3, gamma=0.8, as_cmap = True)
sns.heatmap(pt, linewidths = 0.05, ax = ax1, cmap=cmap, center=None )
ax1.set_title('center=None')
ax1.set_xlabel('')
ax1.set_xticklabels([]) #设置x轴图例为空值ax1.set_ylabel('kind')# 当center设置小于数据的均值时,生成的图片颜色要向0值代表的颜色一段偏移sns.heatmap(pt, linewidths = 0.05, ax = ax2, cmap=cmap, center=200)
ax2.set_title('center=3000')
ax2.set_xlabel('region')
ax2.set_ylabel('kind')
#robust的用法(颜色)f, (ax1,ax2) = plt.subplots(figsize = (6,4),nrows=2)

cmap = sns.cubehelix_palette(start = 1.5, rot = 3, gamma=0.8, as_cmap = True)

sns.heatmap(pt, linewidths = 0.05, ax = ax1, cmap=cmap, center=None, robust=False )
ax1.set_title('robust=False')
ax1.set_xlabel('')
ax1.set_xticklabels([]) #设置x轴图例为空值ax1.set_ylabel('kind')

sns.heatmap(pt, linewidths = 0.05, ax = ax2, cmap=cmap, center=None, robust=True )
ax2.set_title('robust=True')
ax2.set_xlabel('region')
ax2.set_ylabel('kind')
#annot(矩阵上数字),annot_kws(矩阵上数字的大小颜色字体)matplotlib包text类下的字体设置import numpy as np
np.random.seed(20180316)
x = np.random.randn(4, 4)

f, (ax1, ax2) = plt.subplots(figsize=(6,6),nrows=2)

sns.heatmap(x, annot=True, ax=ax1)

sns.heatmap(x, annot=True, ax=ax2, annot_kws={'size':9,'weight':'bold', 'color':'blue'})# Keyword arguments for ax.text when annot is True.  http://stackoverflow.com/questions/35024475/seaborn-heatmap-key-words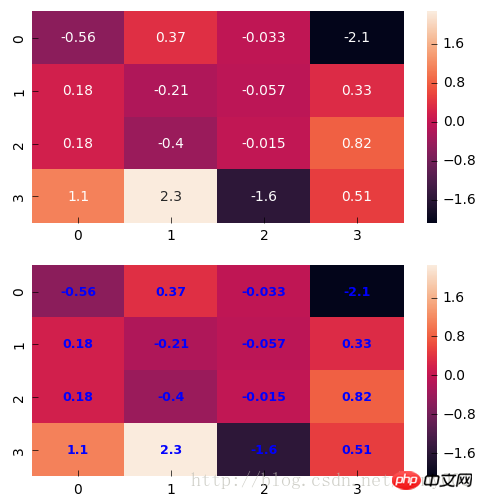
#fmt(字符串格式代码,矩阵上标识数字的数据格式,比如保留小数点后几位数字)import numpy as np
np.random.seed(0)
x = np.random.randn(4,4)

f, (ax1, ax2) = plt.subplots(figsize=(6,6),nrows=2)

sns.heatmap(x, annot=True, ax=ax1)

sns.heatmap(x, annot=True, fmt='.1f', ax=ax2)
#linewidths(矩阵小块的间隔),linecolor(切分热力图矩阵小块的线的颜色)import matplotlib.pyplot as plt
f, ax = plt.subplots(figsize = (6,4))
cmap = sns.cubehelix_palette(start = 1, rot = 3, gamma=0.8, as_cmap = True)
sns.heatmap(pt, cmap = cmap, linewidths = 0.05, linecolor= 'red', ax = ax)
ax.set_title('Amounts per kind and region')
ax.set_xlabel('region')
ax.set_ylabel('kind')
#xticklabels,yticklabels横轴和纵轴的标签名输出import matplotlib.pyplot as plt
f, (ax1,ax2) = plt.subplots(figsize = (5,5),nrows=2)

cmap = sns.cubehelix_palette(start = 1.5, rot = 3, gamma=0.8, as_cmap = True)

p1 = sns.heatmap(pt, ax=ax1, cmap=cmap, center=None, xticklabels=False)
ax1.set_title('xticklabels=None',fontsize=8)

p2 = sns.heatmap(pt, ax=ax2, cmap=cmap, center=None, xticklabels=2, yticklabels=list(range(5)))
ax2.set_title('xticklabels=2, yticklabels is a list',fontsize=8)
ax2.set_xlabel('region')
#mask对某些矩阵块的显示进行覆盖 f, (ax1,ax2) = plt.subplots(figsize = (5,5),nrows=2) cmap = sns.cubehelix_palette(start = 1.5, rot = 3, gamma=0.8, as_cmap = True) p1 = sns.heatmap(pt, ax=ax1, cmap=cmap, xticklabels=False, mask=None) ax1.set_title('mask=None') ax1.set_ylabel('kind') p2 = sns.heatmap(pt, ax=ax2, cmap=cmap, xticklabels=True, mask=(pt<800)) #mask对pt进行布尔型转化,结果为True的位置用白色覆盖 ax2.set_title('mask: boolean DataFrame') ax2.set_xlabel('region') ax2.set_ylabel('kind')
f,(ax1,ax2) = plt.subplots(figsize=(4,6),nrows=2)
x = np.array([[1,2,3],[2,0,1],[-1,-2,0]])
sns.heatmap(x, annot=True, ax=ax1)
sns.heatmap(x, mask=x < 1, ax=ax2, annot=True, annot_kws={"weight": "bold"})   #把小于1的区域覆盖掉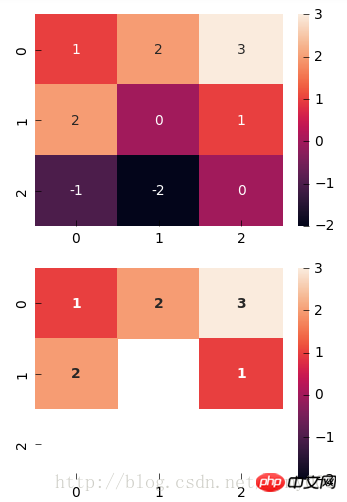
위 내용은 Python에서 시각적 히트맵을 구현하는 방법의 상세 내용입니다. 자세한 내용은 PHP 중국어 웹사이트의 기타 관련 기사를 참조하세요!