
Recently, several people in the group asked how to paste the echarts chart on the three.js model. This problem is actually very simple, because both are rendered into canvas, and you can directly use the canvas generated by echarts as a texture.
The method is sure to be feasible, then we will start coding directly.
Let’s first build a basic scene of three, which I won’t repeat here.
Then create a new plane, and we can paste the picture on this plane.
[Related course recommendations:JavaScript Video Tutorial]
addPlane() { var geometry = new THREE.PlaneGeometry(10,10); var material = new THREE.MeshBasicMaterial({ side: THREE.DoubleSide, // transparent:true }); this.plane = new THREE.Mesh(geometry, material); this.scene.add(this.plane); }
Set the angle of the camera. At this time, there is a whiteboard in the scene.
Then open the official website of echarts, find the case, and create a dashboard. Copy the code. start running.
For the convenience of demonstration, I created two divs in the body as containers for three and the chart respectively. In actual development, the container of the chart does not need to be displayed, nor does it need to be added to the body.
var myChart = echarts.init(document.getElementById('echart')); option = { tooltip: { formatter: "{a}
{b} : {c}%" }, //toolbox会在右上角生成两个功能按钮,咱们不需要,直接干掉。 // toolbox: { // feature: { // restore: {}, // saveAsImage: {} // } // }, series: [ { name: '业务指标', type: 'gauge', detail: { formatter: '{value}%' }, data: [{ value: 50, name: '完成率' }] } ] }; option.series[0].data[0].value = (Math.random() * 100).toFixed(2) - 0; myChart.setOption(option, true); const dom = document.getElementById("webgl"); const scene = new Basescene(dom); scene.addPlane();
At this time I saw the following page:
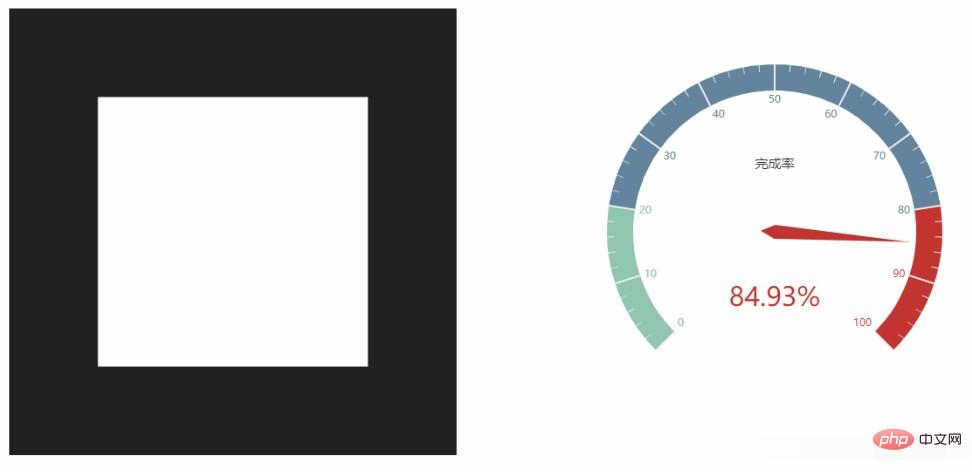
Method 1: CanvasTexture
three.js has a api:CanvasTexture. You can pass in a canvas object and use this method to complete the above tasks.
CanvasTexture( canvas : HTMLElement, mapping : Constant, wrapS : Constant, wrapT : Constant, magFilter : Constant, minFilter : Constant, format : Constant, type : Constant, anisotropy : Number )
changeTextureT(texture){ this.plane.material.map = new THREE.CanvasTexture(texture) this.plane.material.needsUpdate = true var thiscancas = document.getElementById("echart").getElementsByTagName('canvas')[0] scene.changeTextureT(thiscancas) }
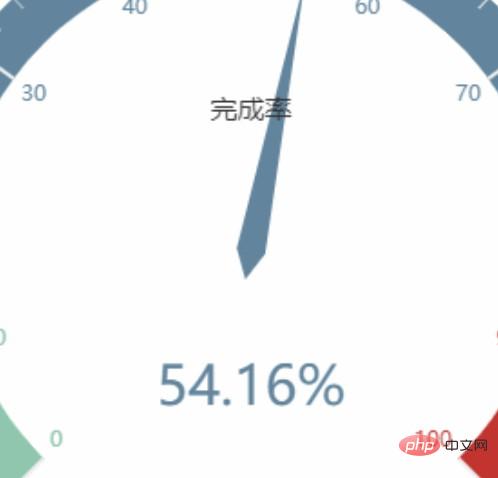
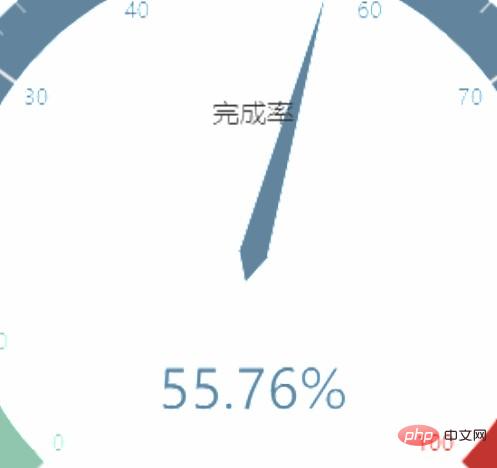
The running results are as follows, which are indeed unclear and are the same as the problems they encountered. Try to draw echarts larger, but this is adaptive, resulting in an ugly dashboard, which is not what you imagined. If you draw the table yourself, you can deal with it this way.
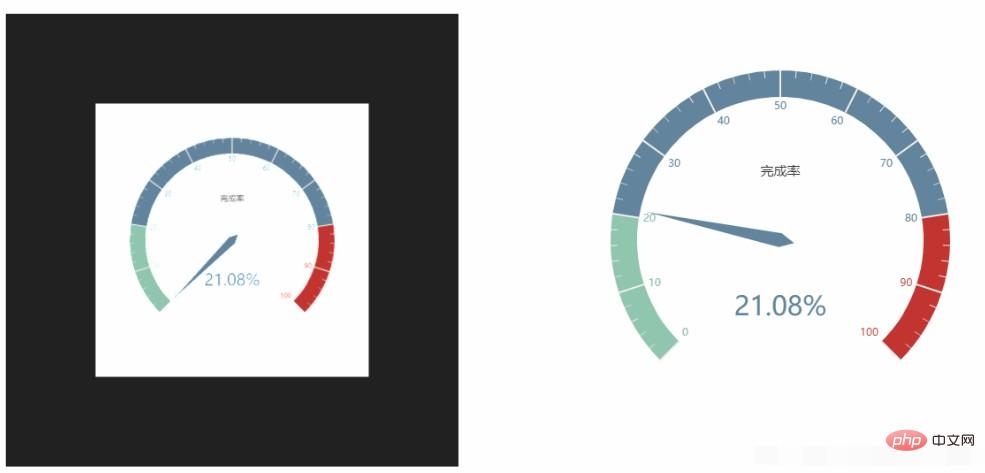
Method 2: getDataURL
Since echarts also renders canvas, look at the API, there should be a way to export images. It is the API below, and there are optional parameters to set the resolution.
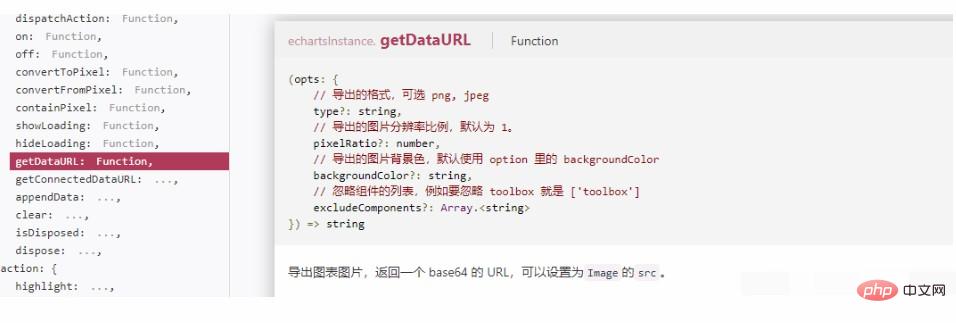
changeTextureE(texture){ this.plane.material.map = new THREE.TextureLoader().load(texture) this.plane.material.needsUpdate = true } var texture = myChart.getDataURL({ pixelRatio: 4, backgroundColor: '#fff' }); scene.changeTextureE(texture)
Setting the resolution to 4 is indeed much clearer.
The following three pictures are the comparison of the effects of resolution 1, resolution 4 and method 1 respectively.

js tutorialcolumn, welcome to learn!
The above is the detailed content of Detailed explanation of the application of charts generated by echarts in three.js. For more information, please follow other related articles on the PHP Chinese website!