


Snowflake は、Snowflake Copilot と呼ばれる LLM アシスタント機能をプレビュー機能としてリリースしました。 Snowflake Copilot を使用すると、自然言語を使用してテーブル データを分析できます。
一方、Snowflake (SiS) の Streamlit を使用すると、生成 AI を簡単に組み込み、テーブル データに安全にアクセスできます。そこで私は、もっと積極的な自然言語データ分析ツールを作成できないだろうかと考えました。そこで、自然言語を使用してデータを分析および視覚化できるアプリを開発しました。
注: この投稿は私の個人的な見解を表すものであり、Snowflake の見解ではありません。
以下は、Cortex LLM (snowflake-arctic) を使用した解析結果の抜粋です。
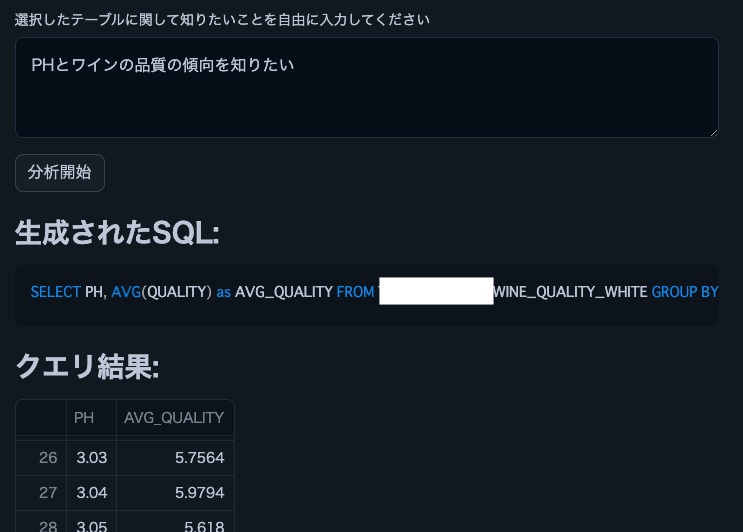
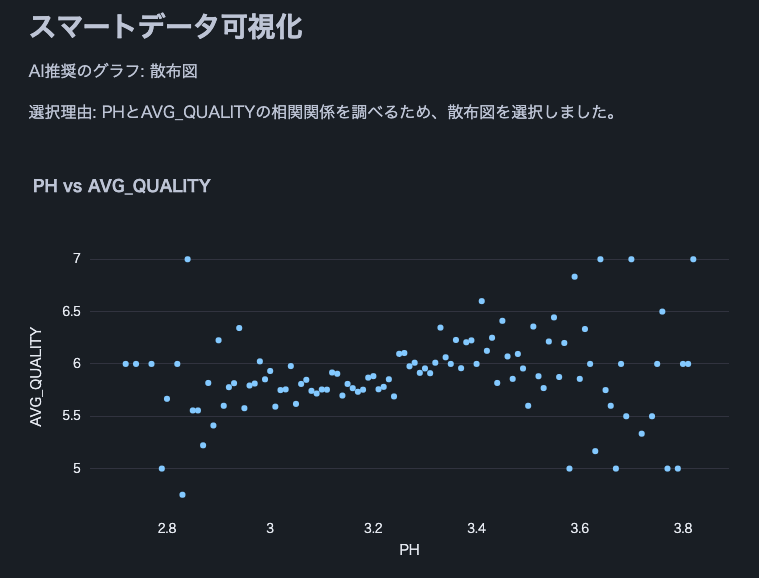

注: このワイン品質データセットを使用しました。
from snowflake.snowpark.context import get_active_session import streamlit as st from snowflake.cortex import Complete as CompleteText import snowflake.snowpark.functions as F import pandas as pd import numpy as np import json import plotly.express as px # Get current session session = get_active_session() # Application title st.title("Natural Language Data Analysis App") # Cortex LLM settings st.sidebar.title("Cortex LLM Settings") lang_model = st.sidebar.radio("Select the language model you want to use", ("snowflake-arctic", "reka-flash", "reka-core", "mistral-large2", "mistral-large", "mixtral-8x7b", "mistral-7b", "llama3.1-405b", "llama3.1-70b", "llama3.1-8b", "llama3-70b", "llama3-8b", "llama2-70b-chat", "jamba-instruct", "gemma-7b") ) # Function to escape column names def escape_column_name(name): return f'"{name}"' # Function to get table information def get_table_info(database, schema, table): # Get column information columns = session.sql(f"DESCRIBE TABLE {database}.{schema}.{table}").collect() # Create DataFrame column_df = pd.DataFrame(columns) # Get row count row_count = session.sql(f"SELECT COUNT(*) as count FROM {database}.{schema}.{table}").collect()[0]['COUNT'] # Get sample data sample_data = session.sql(f"SELECT * FROM {database}.{schema}.{table} LIMIT 5").collect() sample_df = pd.DataFrame(sample_data) return column_df, row_count, sample_df # Data analysis function def analyze(df, query): st.subheader("Result Analysis") # Display basic statistical information st.subheader("Basic Statistics") st.write(df.describe()) # Use AI for data analysis analysis_prompt = f""" Based on the following dataframe and original question, please perform data analysis. Concisely explain in English the insights, trends, and anomalies derived from the data. If possible, please also mention the following points: 1. Data distribution and characteristics 2. Presence of abnormal values or outliers 3. Correlations between columns (if there are multiple numeric columns) 4. Time-series trends (if there is date or time data) 5. Category-specific features (if data can be divided by categories) Dataframe: {df.to_string()} Original question: {query} """ analysis = CompleteText(lang_model, analysis_prompt) st.write(analysis) # Data visualization function def smart_data_visualization(df): st.subheader("Smart Data Visualization") if df.empty: st.warning("The dataframe is empty. There is no data to visualize.") return # Request AI for graph suggestion columns_info = "\n".join([f"{col} - type: {df[col].dtype}" for col in df.columns]) sample_data = df.head().to_string() visualization_prompt = f""" Analyze the information of the following dataframe and suggest the most appropriate graph type and the columns to use for its x-axis and y-axis. Consider the characteristics of the data to ensure a meaningful visualization. Column information: {columns_info} Sample data: {sample_data} Please provide only the following JSON data format as your response: {{ "graph_type": "One of: scatter plot, bar chart, line chart, histogram, box plot", "x_axis": "Column name to use for x-axis", "y_axis": "Column name to use for y-axis (if applicable)", "explanation": "Brief explanation of the selection reason" }} """ ai_suggestion = CompleteText(lang_model, visualization_prompt) try: suggestion = json.loads(ai_suggestion) graph_type = suggestion['graph_type'] x_axis = suggestion['x_axis'] y_axis = suggestion.get('y_axis') # y-axis might not be needed in some cases explanation = suggestion['explanation'] st.write(f"AI recommended graph: {graph_type}") st.write(f"Selection reason: {explanation}") if graph_type == "scatter plot": fig = px.scatter(df, x=x_axis, y=y_axis, title=f"{x_axis} vs {y_axis}") elif graph_type == "bar chart": fig = px.bar(df, x=x_axis, y=y_axis, title=f"{y_axis} by {x_axis}") elif graph_type == "line chart": fig = px.line(df, x=x_axis, y=y_axis, title=f"{y_axis} over {x_axis}") elif graph_type == "histogram": fig = px.histogram(df, x=x_axis, title=f"Distribution of {x_axis}") elif graph_type == "box plot": fig = px.box(df, x=x_axis, y=y_axis, title=f"Distribution of {y_axis} by {x_axis}") else: st.warning(f"Unsupported graph type: {graph_type}") return st.plotly_chart(fig) except json.JSONDecodeError: st.error("Failed to parse AI suggestion. Please try again.") except KeyError as e: st.error(f"AI suggestion is missing necessary information: {str(e)}") except Exception as e: st.error(f"An error occurred while creating the graph: {str(e)}") # AI interpretation of visualization visualization_interpretation_prompt = f""" Based on the following dataset and created graph, please provide a detailed interpretation of the data trends and characteristics in English. Point out possible insights, patterns, anomalies, or areas that require additional analysis. Dataset information: Columns: {', '.join(df.columns)} Number of rows: {len(df)} Created graph: Type: {graph_type} X-axis: {x_axis} Y-axis: {y_axis if y_axis else 'None'} """ ai_interpretation = CompleteText(lang_model, visualization_interpretation_prompt) st.subheader("AI Interpretation of the Graph") st.write(ai_interpretation) # Function to handle cases where AI response is not just SQL query def clean_sql_query(query): # Remove leading and trailing whitespace query = query.strip() # If not starting with SQL keywords, remove everything up to the first SELECT if not query.upper().startswith(('SELECT')): keywords = ['SELECT'] for keyword in keywords: if keyword in query.upper(): query = query[query.upper().index(keyword):] break return query # Function for natural language querying of DB def data_analysis_and_natural_language_query(): # Database selection databases = session.sql("SHOW DATABASES").collect() database_names = [row['name'] for row in databases] selected_database = st.selectbox("Select a database", database_names) if selected_database: # Schema selection schemas = session.sql(f"SHOW SCHEMAS IN DATABASE {selected_database}").collect() schema_names = [row['name'] for row in schemas] selected_schema = st.selectbox("Select a schema", schema_names) if selected_schema: # Table selection tables = session.sql(f"SHOW TABLES IN {selected_database}.{selected_schema}").collect() table_names = [row['name'] for row in tables] selected_table = st.selectbox("Select a table", table_names) if selected_table: # Get table information column_df, row_count, sample_df = get_table_info(selected_database, selected_schema, selected_table) st.subheader("Table Information") st.write(f"Table name: `{selected_database}.{selected_schema}.{selected_table}`") st.write(f"Total rows: **{row_count:,}**") st.subheader("Column Information") st.dataframe(column_df) st.subheader("Sample Data (showing only 5 rows)") st.dataframe(sample_df) # Stringify table information (for AI) table_info = f""" Table name: {selected_database}.{selected_schema}.{selected_table} Total rows: {row_count} Column information: {column_df.to_string(index=False)} Sample data: {sample_df.to_string(index=False)} """ # Natural language input from user user_query = st.text_area("Enter what you want to know about the selected table") if st.button("Start Analysis"): if user_query: # Use AI to generate SQL prompt = f""" Based on the following table information and question, please generate an appropriate SQL query. Return only the generated SQL query without any additional response. Table information: {table_info} Question: {user_query} Notes: - Follow Snowflake SQL syntax. - Use aggregate functions to keep the query result size manageable. - Use {selected_database}.{selected_schema}.{selected_table} as the table name. """ generated_sql = CompleteText(lang_model, prompt) generated_sql = clean_sql_query(generated_sql) st.subheader("Generated SQL:") st.code(generated_sql, language='sql') try: # Execute the generated SQL result = session.sql(generated_sql).collect() df = pd.DataFrame(result) st.subheader("Query Result:") st.dataframe(df) # Analyze results analyze(df, user_query) # Smart data visualization smart_data_visualization(df) except Exception as e: st.error(f"An error occurred while executing the query: {str(e)}") else: st.warning("Please enter a question.") # Execution part data_analysis_and_natural_language_query()
SQL や Python の知識がなくても、自然言語を使用してテーブル データを簡単に分析できる機能は、ビジネス ユーザーにとって企業におけるデータ活用の範囲を大幅に広げる可能性があります。複数のテーブルを結合したり、視覚化グラフの種類を増やすなどの機能を追加することで、さらに複雑な分析を実行できます。皆さんも、Snowflake で Streamlit を使用してデータ分析の民主化を実装してみることをお勧めします。
X に関する Snowflake の新着情報を共有しています。ご興味がございましたら、お気軽にフォローしてください。
Snowflake 新着情報ボット (英語版)
https://x.com/snow_new_ja
Snowflake 新着情報ボット (日本語版)
https://x.com/snow_new_jp
(20240914) 最初の投稿
https://zenn.dev/tsubasa_tech/articles/2608c820294860
以上がSnowflake (SiS) の Streamlit を使用して自然言語データ分析を試してみるの詳細内容です。詳細については、PHP 中国語 Web サイトの他の関連記事を参照してください。


![[Web フロントエンド] Node.js クイック スタート](https://img.php.cn/upload/course/000/000/067/662b5d34ba7c0227.png)


