


IOS Memory Management
Introduction
The basic idea of memory management under iOS is reference counting. The life cycle of memory objects is controlled through the reference counting of objects. . Specific to programming time, there are two main methods:
1: MRR (manual retain-release), manual reference counting, object generation, destruction, and reference count changes are all completed by developers.
2: ARC (Automatic Reference Counting), automatic reference counting, is only responsible for the generation of objects. Developers of other processes no longer need to care about their destruction. The usage method is similar to garbage collection, but its essence is still reference counting.
Problems faced
According to Apple's documentation, the two main problems faced are:
The data released or overwritten is still in use. This will cause memory corruption, usually crashing the application, or worse, corrupting user data.
Not releasing data that is no longer used can lead to memory leaks. The memory allocated in a memory leak is not freed, even if it is never used again. Leaks can lead to increasing memory usage by applications, which in turn can cause poor system performance or freezes.
Memory Management Rules
We create our own objects and release them when they are no longer needed.
Keep the objects you need to use. These objects must be released if no longer necessary.
Don't release objects we don't own.
Use memory management tools
You can analyze memory usage with the help of Xcode tools and instruments. It includes tools such as Activity Monitor, Allocation, Leak, Zombie, etc.
Steps to analyze memory allocation
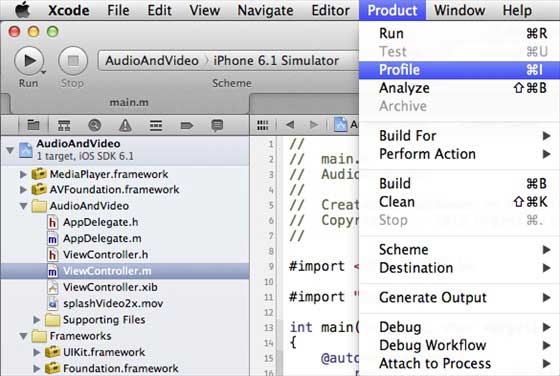
1. Open an existing application.
2. Select the product and the configuration file is as follows
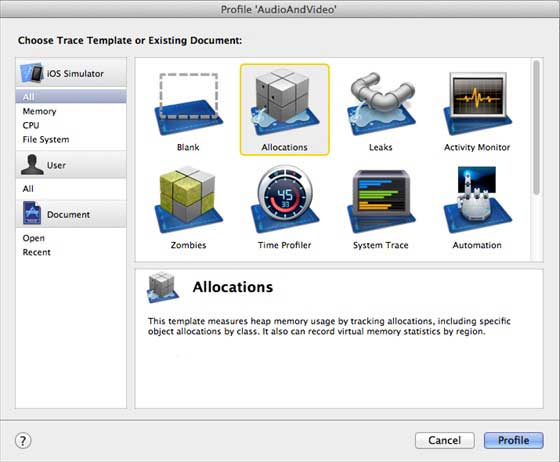
3. Select Allocations and Profile in the following interface.
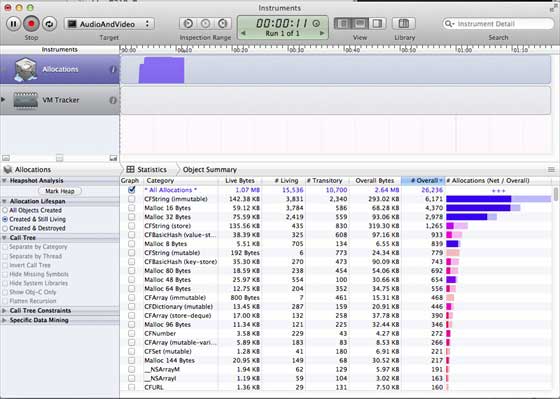
#4. We can see the memory usage of different objects
5. You can switch the view controller to see whether the memory is released.
#6. Similarly, we can use Activity Monitor to view the allocation of memory in the application.
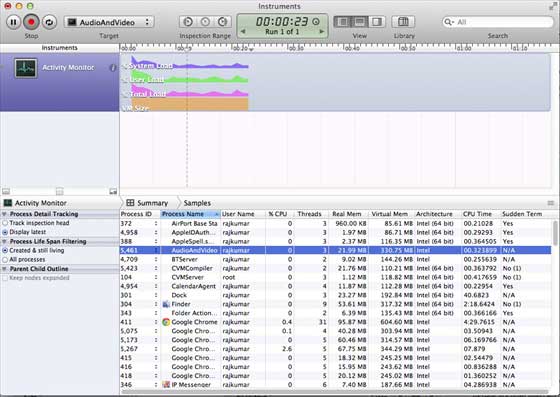
#7. These tools can help us understand memory usage and where leaks may occur.


![Getting Started with PHP Practical Development: PHP Quick Creation [Small Business Forum]](https://img.php.cn/upload/course/000/000/035/5d27fb58823dc974.jpg)


