

Introduction à JpGraph
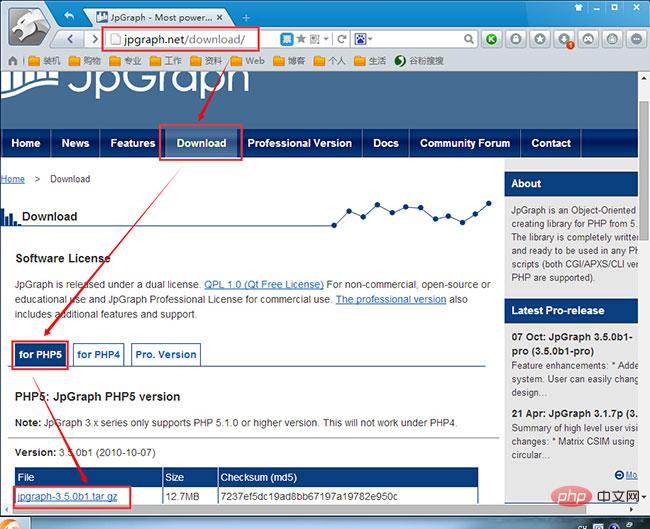
JpGraph est une bibliothèque de génération de graphiques statistiques PHP open source, construite sur la base des graphiques GD2 de PHP bibliothèque. Encapsule les opérations associées à la génération de graphiques statistiques et masque certaines opérations complexes, ce qui facilite la sortie de graphiques statistiques sur la page PHP. Le site officiel de JpGraph est : http://jpgraph.net, où les développeurs peuvent télécharger gratuitement la dernière version de JpGraph et lire des documents d'aide ou des exemples de programmes associés.
Recommandations d'apprentissage associées : Programmation PHP de l'entrée à la maîtrise
Configuration JpGraph
(1) Modifier le fichier php.ini
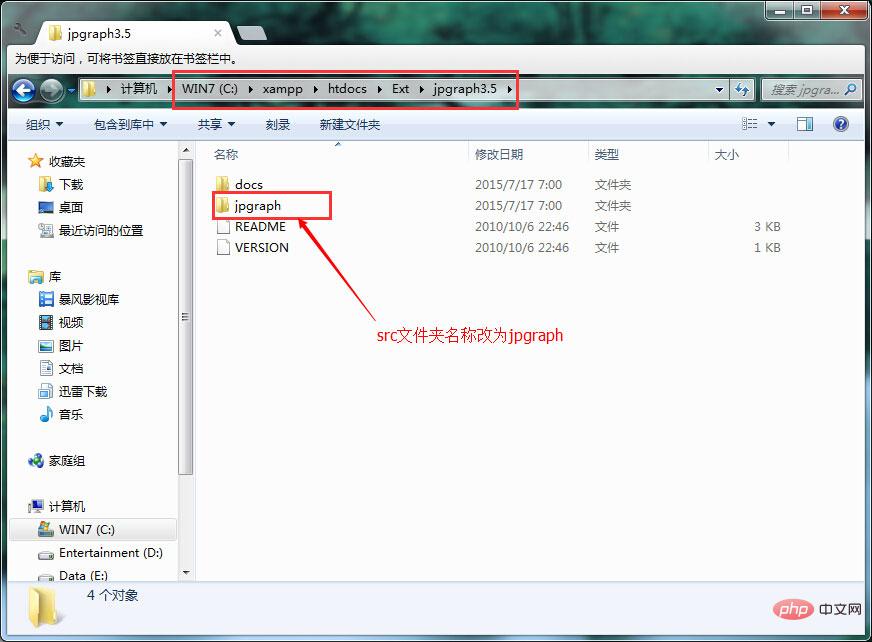
Ajouter le chemin du répertoire de jpgraph dans include_path, et décompresser le src de jpgraph Le le nom du répertoire est changé en jpg.

(2) Vérifiez si PHP prend en charge la bibliothèque GD
Recherchez la déclaration;extension=php_gd2.dll dans le fichier php.ini. Supprimez le signe ; avant l’instruction ci-dessus, c’est-à-dire supprimez le commentaire. Si vous ne trouvez pas cette instruction à cause des différentes versions de PHP, vous pouvez directement ajouter extension=php_gd2.dll
(3) Modifier le fichier jpgraph_gb2312.php
Trouvez la fonction : function gb2utf8($gb)
Modifiez la fonction en :
  function gb2utf8($gb) {
  return $gb;
}C'est-à-dire le code qui n'utilise pas l'encodage gb2 pour convertir en utf8.

Graphique linéaire
<?php
require_once ("jpgraph/jpgraph.php");
require_once ("jpgraph/jpgraph_line.php");

$data1 = array(523,634,371,278,685,587,490,256,398,545,367,577); //第一条曲线的数组

$graph = new Graph(500,300);
$graph->SetScale("textlin");
$graph->SetShadow();
$graph->img->SetMargin(60,30,30,70); //设置图像边距

$graph->graph_theme = null; //设置主题为null,否则value->Show(); 无效

$lineplot1=new LinePlot($data1); //创建设置两条曲线对象
$lineplot1->value->SetColor("red");
$lineplot1->value->Show();
$graph->Add($lineplot1); //将曲线放置到图像上

$graph->title->Set("CDN流量图");  //设置图像标题
$graph->xaxis->title->Set("月份"); //设置坐标轴名称
$graph->yaxis->title->Set("流 量(Gbits)");
$graph->title->SetMargin(10);
$graph->xaxis->title->SetMargin(10);
$graph->yaxis->title->SetMargin(10);

$graph->title->SetFont(FF_SIMSUN,FS_BOLD); //设置字体
$graph->yaxis->title->SetFont(FF_SIMSUN,FS_BOLD);
$graph->xaxis->title->SetFont(FF_SIMSUN,FS_BOLD);
$graph->xaxis->SetTickLabels($gDateLocale->GetShortMonth());
$graph->Stroke(); //输出图像
?>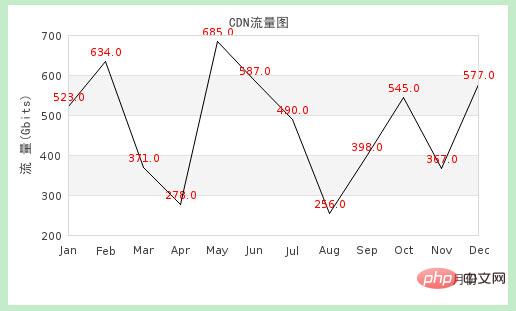
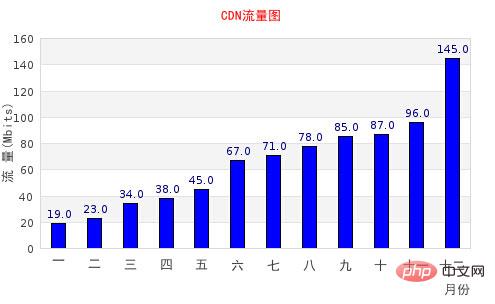
Diagramme à barres
<?php
require_once ("jpgraph/jpgraph.php");
require_once ("jpgraph/jpgraph_bar.php");
$data = array(19,23,34,38,45,67,71,78,85,87,96,145);
$ydata = array("一","二","三","四","五","六","七","八","九","十","十一","十二");
$graph = new Graph(500,300); //创建新的Graph对象
$graph->SetScale("textlin"); //刻度样式
$graph->SetShadow(); //设置阴影
$graph->img->SetMargin(40,30,40,50); //设置边距
$graph->graph_theme = null; //设置主题为null,否则value->Show(); 无效
$barplot = new BarPlot($data); //创建BarPlot对象
$barplot->SetFillColor('blue'); //设置颜色
$barplot->value->Show(); //设置显示数字
$graph->Add($barplot); //将柱形图添加到图像中
$graph->title->Set("CDN流量图");
$graph->xaxis->title->Set("月份"); //设置标题和X-Y轴标题
$graph->yaxis->title->Set("流 量(Mbits)");
$graph->title->SetColor("red");
$graph->title->SetMargin(10);
$graph->xaxis->title->SetMargin(5);
$graph->xaxis->SetTickLabels($ydata);
$graph->title->SetFont(FF_SIMSUN,FS_BOLD); //设置字体
$graph->yaxis->title->SetFont(FF_SIMSUN,FS_BOLD);
$graph->xaxis->title->SetFont(FF_SIMSUN,FS_BOLD);
$graph->xaxis->SetFont(FF_SIMSUN,FS_BOLD);
$graph->Stroke();
?>
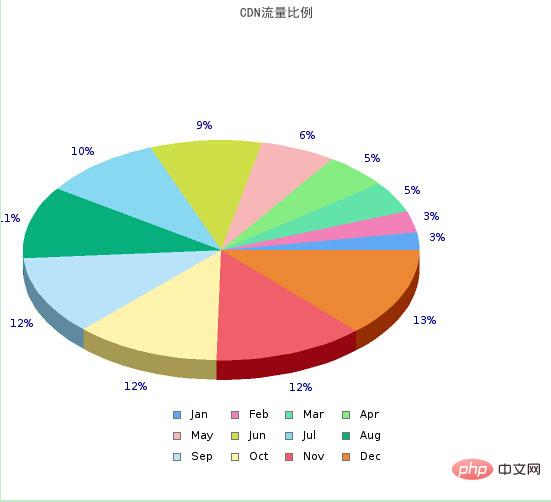
Graphique circulaire
<?php
require_once ("jpgraph/jpgraph.php");
require_once ("jpgraph/jpgraph_pie.php");
require_once ("jpgraph/jpgraph_pie3d.php");

$data = array(19,23,34,38,45,67,71,78,85,87,90,96);

$graph = new PieGraph(550,500);
$graph->SetShadow();

$graph->title->Set("CDN流量比例");
$graph->title->SetFont(FF_SIMSUN,FS_BOLD);

$pieplot = new PiePlot3D($data); //创建PiePlot3D对象
$pieplot->SetCenter(0.4, 0.5); //设置饼图中心的位置
$pieplot->SetLegends($gDateLocale->GetShortMonth()); //设置图例
$graph->Add($pieplot);
$graph->Stroke();
?>
Ce qui précède est le contenu détaillé de. pour plus d'informations, suivez d'autres articles connexes sur le site Web de PHP en chinois!
 Comment ouvrir le fichier php
 Comment supprimer les premiers éléments d'un tableau en php
 Que faire si la désérialisation php échoue
 Comment connecter PHP à la base de données mssql
 Comment connecter PHP à la base de données mssql
 Comment télécharger du HTML
 Comment résoudre les caractères tronqués en PHP
 Comment ouvrir des fichiers php sur un téléphone mobile