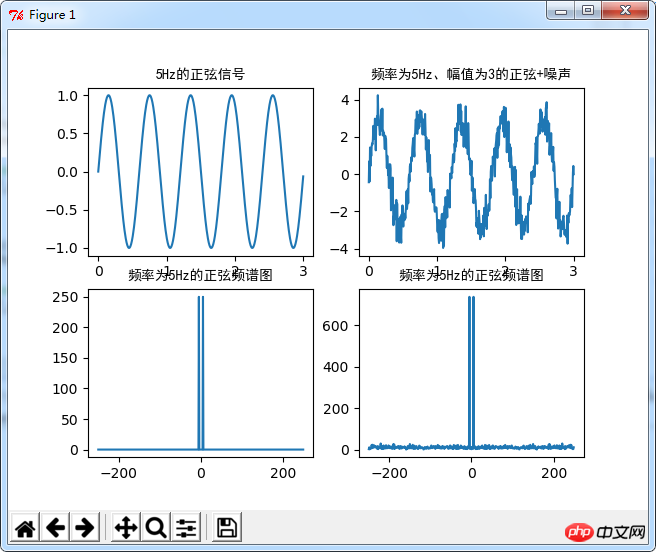
Cet article présente principalement Python pour implémenter la forme d'onde dans le domaine temporel et le spectrogramme des signaux sinusoïdaux, impliquant des opérations mathématiques Python et des compétences opérationnelles liées au dessin graphique. Les amis dans le besoin peuvent s'y référer
Cet article décrit l'implémentation de Python. avec des exemples Formes d'onde dans le domaine temporel et spectrogrammes de signaux sinusoïdaux. Partagez-le avec tout le monde pour votre référence, les détails sont les suivants :
# -*- coding: utf-8 -*-
# 正弦信号的时域波形与频谱图
import numpy as np
import matplotlib.pyplot as pl
import matplotlib
import math
import random
row = 4
col = 4
N = 500
fs = 5
n = [2*math.pi*fs*t/N for t in range(N)]  # 生成了500个介于0.0-31.35之间的点
# print n
axis_x = np.linspace(0,3,num=N)
#频率为5Hz的正弦信号
x = [math.sin(i) for i in n]
pl.subplot(221)
pl.plot(axis_x,x)
pl.title(u'5Hz的正弦信号',fontproperties='SimHei')
pl.axis('tight')
#频率为5Hz、幅值为3的正弦+噪声
x1 = [random.gauss(0,0.5) for i in range(N)]
xx = []
#有没有直接两个列表对应项相加的方式??
for i in range(len(x)):
  xx.append(x[i]*3 + x1[i])
pl.subplot(222)
pl.plot(axis_x,xx)
pl.title(u'频率为5Hz、幅值为3的正弦+噪声',fontproperties='SimHei')
pl.axis('tight')
#频谱绘制
xf = np.fft.fft(x)
xf_abs = np.fft.fftshift(abs(xf))
axis_xf = np.linspace(-N/2,N/2-1,num=N)
pl.subplot(223)
pl.title(u'频率为5Hz的正弦频谱图',fontproperties='SimHei')
pl.plot(axis_xf,xf_abs)
pl.axis('tight')
#频谱绘制
xf = np.fft.fft(xx)
xf_abs = np.fft.fftshift(abs(xf))
pl.subplot(224)
pl.title(u'频率为5Hz的正弦频谱图',fontproperties='SimHei')
pl.plot(axis_xf,xf_abs)
pl.axis('tight')
pl.show()
Effet opérationnel :

Connexe recommandé :
Exemple de l'algorithme multiple le moins courant implémenté en Python
Ce qui précède est le contenu détaillé de. pour plus d'informations, suivez d'autres articles connexes sur le site Web de PHP en chinois!