


Linux 60 seconds analysis
This checklist is suitable for analyzing performance issues and records the actions I typically perform within the first 60 seconds after logging into a poorly performing Linux system.
uptimedmesg | tail && cat /var/log/messagesvmstat 1mpstat -P ALL 1pidstat 1iostat -xz 1free -msar -n DEV 1sar -n tcp,ETCP 1sar -n SOCK 1 3topuptimecommand is used to display the time the system has been running and provide information about the system load average. The following is an explanation of the information provided by theuptimecommand:
┌──[liruilong@liruilongs.github.io]-[~] └─$man uptime UPTIME(1) User Commands UPTIME(1) NAME uptime - Tell how long the system has been running. SYNOPSIS uptime [options] DESCRIPTION uptimegives a one line display of the following information.The current time, how long the system has been running, how many users are currently logged on, and the system load averages for the past 1, 5, and15min‐ utes. This is the same information contained in the header line displayed by w(1). Systemloadaveragesistheaveragenumber of processes that are either in a runnable or uninterruptable state.A process in a runnable state is either using the CPU or waiting to use the CPU.A processinunin‐ terruptablestate is waiting for some I/O access, eg waiting for disk.The averages are taken over the three time intervals.Load averages are not normalized for the number of CPUs in a system, so a load averageof1 means a single CPU system is loaded all the time while on a 4 CPU system it means it was idle 75% of the time. ......................................
uptime can quickly view thecurrent system timeandrunning time, the totallogged in users, and theaverage load:
┌──[root@vms100.liruilongs.github.io]-[~] └─$uptime 11:14:26 up 16 min,1 user,load average: 21.37, 18.64, 16.25
The main focus here isAverage load:
On Linux systems, these numbers include processesthat want to run on theCPU, but alsoprocesses blocked on uninterruptible IO (usually disk I/O). This gives a high-level view ofresource load (or resource demand).
The three numbersare respectivelyexponentially decaying 1 minute/5 minute/15 minute sliding window cumulative values. Through these three values, you can roughly understand theload changes over time.
To quickly check the number of CPU cores, you can use thetopcommand and then press the1key to view
top - 11:21:36 up 23 min,1 user,load average: 22.36, 19.03, 17.14 Tasks: 443 total, 5 running, 438 sleeping, 0 stopped, 0 zombie %Cpu0:6.4 us,5.4 sy,0.0 ni, 77.9 id,0.0 wa,4.4 hi,5.9 si,0.0 st %Cpu1:9.2 us, 12.2 sy,0.0 ni, 71.9 id,3.6 wa,2.0 hi,1.0 si,0.0 st %Cpu2:4.8 us,3.6 sy,0.0 ni, 68.8 id,4.8 wa, 18.0 hi,0.0 si,0.0 st %Cpu3:4.5 us,5.5 sy,0.0 ni, 72.7 id,2.7 wa,0.5 hi, 14.1 si,0.0 st MiB Mem :15730.5 total, 7489.9 free, 6823.5 used, 1417.2 buff/cache MiB Swap: 2068.0 total, 2068.0 free,0.0 used. 8496.2 avail Mem
The above example shows that the load has increased significantly recently. Under normal circumstances (is also affected by other factors, I/O operations, etc.), the relationship between theload number and the number of system CPU corescan be understood by the following rules:
On the basis of thetopcommand and then pressing the1key, you can press thetkey to visually display the data
top - 11:22:26 up 24 min,1 user,load average: 15.02, 17.58, 16.74 Tasks: 449 total,19 running, 430 sleeping, 0 stopped, 0 zombie %Cpu0:24.5/37.1 62[|||||||||||||||||||||||||||||||||||||||||||||||||||||||||] %Cpu1:15.5/28.0 43[|||||||||||||||||||||||||||||||||||||||| ] %Cpu2:37.9/61.1 99[|||||||||||||||||||||||||||||||||||||||||||||||||||||||||||||||||||||||||||||||||||||||||||| ] %Cpu3:15.8/49.7 66[|||||||||||||||||||||||||||||||||||||||||||||||||||||||||||||
is less than 70-80% of the number of CPU cores: This usually means that the system load is light and has enough processing power to handle all tasks. The system response time is shorter and the performance is better.approaches or exceeds 100% of the number of CPU cores: This indicates that the load on the system is very high and is approaching or reaching the limit of its processing capabilities. The system may experience delays or slowdowns, with longer response times.far exceeds 100% of the number of CPU cores: This means that the system'sload is very highand exceeds the system's processing capabilities. The system may experience severe delays or even crash or become unresponsive.Load averagesare worth checking first during the troubleshooting process to confirm whether performance issues still exist. In a fault-tolerant environment, a server with performance problems may be automatically offline from the service list when you log in to the machine.
A high 15-minute loadappearing at the same time as alow 1-minute loadmay mean that the scene of the problem has been missed.
┌──[root@vms100.liruilongs.github.io]-[~] └─$uptime 11:33:45 up 35 min,1 user,load average: 1.39, 6.06, 11.64 ┌──[root@vms100.liruilongs.github.io]-[~] └─$
dmesg | tailorcat /var/log/messagesorjournalctl -k | tailcan also be combined withcat /var/log/messagesto troubleshoot
┌──[liruilong@liruilongs.github.io]-[~] └─$dmesg | tail [ 12.216869] vmwgfx 0000:00:0f.0: [drm] Available shader model: SM_5. [ 12.225954] [drm] Initialized vmwgfx 2.20.0 20211206 for 0000:00:0f.0 on minor 0 [ 12.233005] Bluetooth: hci0: unexpected cc 0x0c12 length: 2 < 3 [ 12.233011] Bluetooth: hci0: Opcode 0x c12 failed: -38 [ 12.238757] fbcon: vmwgfxdrmfb (fb0) is primary device [ 12.248762] Console: switching to colour frame buffer device 160x50 [ 12.269448] vmwgfx 0000:00:0f.0: [drm] fb0: vmwgfxdrmfb frame buffer device [ 14.350586] block dm-0: the capability attribute has been deprecated. [ 14.446480] block nvme0n1: No UUID available providing old NGUID [ 14.498286] block nvme0n1: No UUID available providing old NGUID
This command displays the past 10 system logs, if any. Be careful to look here for errorsthat maycause performance issues. AddT and tto display the corresponding time
┌──[root@vms100.liruilongs.github.io]-[~] └─$dmesg -T| tail [日 1月 14 10:58:57 2024] vmxnet3 0000:1b:00.0 ens256: NIC Link is Up 10000 Mbps [日 1月 14 10:59:38 2024] device ovs-system entered promiscuous mode [日 1月 14 10:59:39 2024] Timeout policy base is empty [日 1月 14 10:59:39 2024] Failed to associated timeout policy `ovs_test_tp' [日 1月 14 10:59:40 2024] device br-tun entered promiscuous mode [日 1月 14 10:59:40 2024] device br-int entered promiscuous mode [日 1月 14 10:59:40 2024] device ens224 entered promiscuous mode [日 1月 14 10:59:40 2024] device br-ex entered promiscuous mode [日 1月 14 11:03:14 2024] capability: warning: `privsep-helper' uses deprecated v2 capabilities in a way that may be insecure [日 1月 14 11:04:34 2024] hrtimer: interrupt took 11973872 ns ┌──[root@vms100.liruilongs.github.io]-[~] └─$
In daily maintenance, it is often combined withgrepto quickly locate problems
┌──[root@liruilongs.github.io]-[~] └─$ dmesg -T | grep -i error [五 11月 10 10:32:57 2023] BERT: Boot Error Record Table support is disabled. Enable it by using bert_enable as kernel parameter. ┌──[root@liruilongs.github.io]-[~] └─$ dmesg -T | grep -i warn [五 11月 10 10:32:54 2023] Warning: Intel Processor - this hardware has not undergone upstream testing. Please consult http://wiki.centos.org/FAQ for more information ┌──[root@liruilongs.github.io]-[~] └─$
For exampleInsufficient memory causesOOM and TCP to discard the request record.
┌──[root@vms83.liruilongs.github.io]-[~] └─$cat /var/log/messages | grep -i memory Aug 10 20:37:27 vms83 kernel: [] out_of_memory+0x4b6/0x4f0 Aug 10 20:37:27 vms83 kernel: Out of memory: Kill process 25143 (bigmem) score 1347 or sacrifice child
TCP related logs even guide our next step of analysis: check the SNMP counter value.
┌──[root@liruilongs.github.io]-[~] └─$man vmstat VMSTAT(8) System Administration VMSTAT(8) NAME vmstat - Report virtual memory statistics SYNOPSIS vmstat [options] [delay [count]] DESCRIPTION vmstat reports information about processes, memory, paging, block IO, traps, disks and cpu activity. The first report produced gives averages since the last reboot.Additional reports give information on a sam‐ pling period of length delay.The process and memory reports are instantaneous in either case. ..........................
┌──[root@vms100.liruilongs.github.io]-[~] └─$vmstat 1 procs -----------memory---------- ---swap-- -----io---- -system-- ------cpu----- rb swpd free buffcache si sobibo in cs us sy id wa st 6900 7700836 4204 144164800 369 101569 1819 11 35 4580 2610 7711264 4204 144166800 012 1209 13809 24 6430 800 7710592 4204 144166400 027779 12154 11 7870 1300 7699752 4204 144166800 0 0766 13133 25 7200 3100 7696384 4204 144228800 01412 1157 2928 12 32 4980 6000 7675296 4204 144429200 026 1068 138249 26 51 140 3400 7670552 4204 144428000 017798 1514 14 52 3410 6010 7686712 4204 144450800 0 8807 21276 24 6730 5920 7676624 4204 144523200 0 8620 68307 66 2250 6800 7677948 4204 144244000 056 1329 3739 13 22 5970 10000 7677920 4204 144234000 021 1030 3778 16 50 2950 1900 7669208 4204 144322000 043958 3054 19 65 1060 520 7776028 4204 144536400 040 1124 20039 18 33 4440 8410 7764600 4204 144724000 036867 23470 14 53 2750 2200 7711224 4204 144732800 0 112 1353 11900 13 34 5040 3600 7734856 4204 144757200 0 321 1382 11113 10 22 47 210 2810 7738716 4204 144650800 0 157889 57793 15 64 180 3000 7719320 4204 144669600 0 151 1409 85265 27 57 100 710 7713972 4204 144719200 025 1372 23431 13 19 6350 1800 7715444 4204 144735600 056935 77506 19 6770 5400 7766760 4204 144063200 064 1237 4686 11 26 5670 5200 7712752 4204 144181600 0 4 1265 6567 25 33 4200 ^C ┌──[root@vms100.liruilongs.github.io]-[~] └─$
The columns that need to be checked include the following:
r:CPU上正在执行的和等待执行的进程数量。相比平均负载来说,这是一个更好的排查CPU饱和度的指标,因为它不包含IO。可以这样解释:一个比CPU数量多的 r 值代表 CPU 资源处于饱和状态。free:空闲内存,单位是KB。如果数字位数一眼数不过来,那么内存应该是够用的。使用free -m命令,可以更好地解释空闲内存。si 和so:页换入和页换出。如果这些值不是零,那么意味着系统内存紧张。这个值只有在配置开启了交换分区后才会起作用。us、sy、id、wa和st:这些都是 CPU运行时间的进一步细分,是对所有的CPU 取平均之后的结果。它们分别代表用户态时间、系统态时间(内核)、空闲率、等待I/O,以及被窃取时间(stolen time,指的是虚拟化环境下,被其他客户机所挤占的时间;或者是Xen 环境下客户机自身隔离的驱动域运行时间)。上面的例子显示了CPU时间主要花在系统态上。这指引我们下一步将主要针对系统态代码进行剖析。
┌──[root@liruilongs.github.io]-[~] └─$vmstat procs -----------memory---------- ---swap-- -----io---- -system-- ------cpu----- rb swpd free buffcache si sobibo in cs us sy id wa st 200 1057540 2072 1761012006827 150159584 8710 ┌──[root@liruilongs.github.io]-[~] └─$
查看CPU平均值,当前系统中,可运行进程为2(r),被阻塞的进程为0(b),系统发生中断次数1501(in),系统发生上下文切换次数为595(cs),系统代码消耗CPU为4%(sy),用户代码消耗CPU为8%(us),系统空闲占比87%(id),剩余1%属于等待IO消耗的CPU空闲状态(wa)
┌──[root@liruilongs.github.io]-[~] └─$vmstat -s .......... 206387 non-nice user cpu ticks 3 nice user cpu ticks 100381 system cpu ticks 2184710 idle cpu ticks 12604 IO-wait cpu ticks 0 IRQ cpu ticks 4699 softirq cpu ticks 0 stolen cpu ticks ............ 37633050 interrupts 64361523 CPU context switches ........... 210962 forks
这里的ticks为一个时间单位,相关数据为自系统启动时间以来的数据。forks表示系统创建以来的进程数,CPU context switches表示上下文文切换次数,interrupts即中断次数,剩下的参数对应上面的列理解即可,stolen cpu 这个不太理解
需要装包
┌──[root@vms100.liruilongs.github.io]-[~] └─$yum install -y sysstat
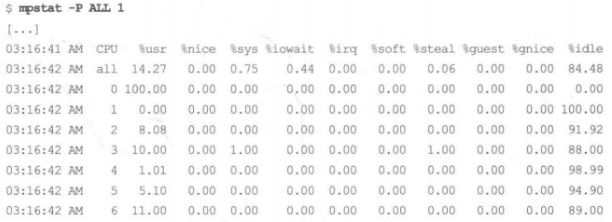
这个命令将每个CPU分解到各个状态下的时间打印出来。
┌──[root@vms100.liruilongs.github.io]-[~] └─$mpstat -P ALL 1 Linux 4.18.0-477.27.1.el8_8.x86_64 (vms100.liruilongs.github.io)2024年01月14日_x86_64_(4 CPU) 11时43分36秒CPU%usr %nice%sys %iowait%irq %soft%steal%guest%gnice %idle 11时43分37秒all 12.890.00 14.84 50.006.254.300.000.000.00 11.72 11时43分37秒0 21.570.00 15.69 50.985.881.960.000.000.003.92 11时43分37秒1 12.680.009.86 76.061.410.000.000.000.000.00 11时43分37秒2 12.700.00 25.403.17 17.460.000.000.000.00 41.27 11时43分37秒37.040.009.86 64.791.41 14.080.000.000.002.82 11时43分37秒CPU%usr %nice%sys %iowait%irq %soft%steal%guest%gnice %idle 11时43分38秒all8.650.00 13.16 31.581.50 12.780.000.000.00 32.33 11时43分38秒0 17.650.00 25.495.881.96 25.490.000.000.00 23.53 11时43分38秒18.000.00 10.67 24.002.67 10.670.000.000.00 44.00 11时43分38秒24.170.009.72 77.780.002.780.000.000.005.56 11时43分38秒37.350.00 10.29 10.291.47 16.180.000.000.00 54.41 11时43分38秒CPU%usr %nice%sys %iowait%irq %soft%steal%guest%gnice %idle 11时43分39秒all8.060.00 10.89 52.42 11.290.000.000.000.00 17.34 11时43分39秒0 12.310.00 12.31 69.236.150.000.000.000.000.00 11时43分39秒14.410.004.41 67.658.820.000.000.000.00 14.71 11时43分39秒28.330.00 13.33 65.008.330.000.000.000.005.00 11时43分39秒37.270.00 14.550.00 23.640.000.000.000.00 54.55 11时43分39秒CPU%usr %nice%sys %iowait%irq %soft%steal%guest%gnice %idle 11时43分40秒all 24.690.007.11 18.832.93 25.940.000.000.00 20.50 11时43分40秒0 46.670.00 17.78 31.112.222.220.000.000.000.00 11时43分40秒1 11.110.006.94 37.500.000.000.000.000.00 44.44 11时43分40秒2 41.460.007.329.760.000.000.000.000.00 41.46 11时43分40秒3 16.050.001.230.007.41 75.310.000.000.000.00 11时43分40秒CPU%usr %nice%sys %iowait%irq %soft%steal%guest%gnice %idle 11时43分41秒all 24.040.00 16.35 12.98 12.506.250.000.000.00 27.88 11时43分41秒0 28.120.00 21.880.00 31.250.000.000.000.00 18.75 11时43分41秒1 21.670.00 20.000.00 20.00 11.670.000.000.00 26.67 11时43分41秒27.580.00 16.67 16.676.061.520.000.000.00 51.52 11时43分41秒3 46.000.008.00 32.000.00 10.000.000.000.004.00
对于比较高的%iowait(等待I/O操作完成占用CPU的百分比,表示CPU时间用于等待I/O操作完成的百分比。)时间也要注意,可以使用磁盘 I/O工具进一步分析
如果出现较高的%sys值(系统态占用),可以使用系统调用(syscall)跟踪和内核跟踪,以及CPU剖析等手段进一步分析。
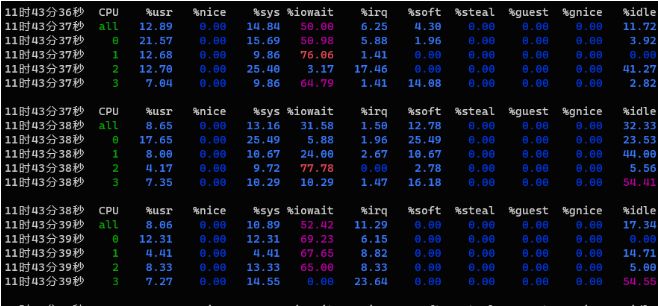
%idle指CPU的空闲率,通过检查单个热点(繁忙)CPU,挑出一个可能的线程扩展性问题
上面的输出暴露了一个问题:CPU0的用户态的占比高达100%,这是单个线程遇到瓶颈的特征。
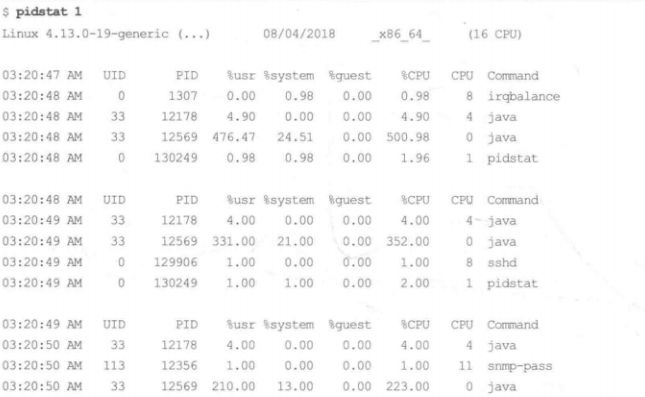
pidstat(1)命令按每个进程展示 CPU的使用情况(包括用户态和系统态时间的分解)。top(l)命令虽然也很流行,但是pidstat(1)默认支持滚动打印输出,这样可以采集到不同时间段的数据变化。
┌──[root@vms100.liruilongs.github.io]-[~] └─$pidstat 3 Linux 4.18.0-477.27.1.el8_8.x86_64 (vms100.liruilongs.github.io)2024年01月14日_x86_64_(4 CPU) 11时31分10秒 UID PID%usr %system%guest %wait%CPU CPUCommand 11时31分13秒 0140.001.990.001.661.99 0rcu_sched 11时31分13秒 0330.000.660.000.000.66 3ksoftirqd/3 11时31分13秒 0 7180.000.330.002.650.33 3kworker/3:3-events 11时31分13秒 0 9701.990.660.000.332.65 0tuned 11时31分13秒 4243521330.660.000.000.660.66 2neutron-dhcp-ag 11时31分13秒 4240721340.330.000.000.000.33 2cinder-schedule 11时31分13秒 4243521370.660.330.000.330.99 0neutron-openvsw 11时31分13秒 4243521820.330.000.000.330.33 3neutron-metadat 11时31分13秒 4241824370.990.330.000.991.32 0heat-engine 11时31分13秒 4241528420.660.990.000.661.66 0glance-api 11时31分13秒 4243629360.990.000.000.660.99 3nova-conductor ................................................ .................................... 平均时间: 4243698190.330.000.001.500.33 -nova-conductor 平均时间: 4241899510.170.500.000.000.66 -heat-engine 平均时间: 4241899520.170.000.000.170.17 -heat-engine 平均时间: 0 241780.000.170.000.000.17 -sshd 平均时间: 42435 426620.330.170.000.330.50 -neutron-l3-agen 平均时间: 0 797750.170.660.000.000.83 -pidstat ┌──[root@vms100.liruilongs.github.io]-[~] └─$
这个输出显示了一个Java 进程每秒使用的CPU 资源在变化:这个百分比是对全部CPU相加的和因此500%相当于5个100%运行的CPU。
┌──[root@vms100.liruilongs.github.io]-[~] └─$iostat -xz Linux 4.18.0-477.27.1.el8_8.x86_64 (vms100.liruilongs.github.io)2024年01月14日_x86_64_(4 CPU) avg-cpu:%user %nice %system %iowait%steal %idle 10.780.00 36.46 20.390.00 32.37 Devicer/s w/s rkB/s wkB/s rrqm/s wrqm/s%rrqm%wrqm r_await w_await aqu-sz rareq-sz wareq-szsvctm%util nvme0n1101.86 23.92 4143.65729.07 0.07 0.98 0.07 3.92 33.62 38.59 4.3540.6830.48 5.1064.21 nvme0n20.550.00 15.620.00 0.00 0.00 0.00 0.00 28.660.00 0.0228.50 0.0019.27 1.06 scd0 0.050.000.010.00 0.00 0.00 0.00 0.000.000.00 0.00 0.17 0.00 0.56 0.00 dm-087.79 24.64 3865.46718.38 0.00 0.00 0.00 0.00 37.96 42.92 4.3944.0329.16 5.5962.87 dm-1 0.510.00 11.590.00 0.00 0.00 0.00 0.004.500.00 0.0022.65 0.00 4.58 0.23
这个工具显示了存储设备的IO 指标。要检查的列包括如下几个。
r/s、w/s、rkB/s和wkB/s:这些是每秒向设备发送的读、写次数,以及读、写字节数。可以用这些指标对业务负载画像。某些性能问题仅仅是因为超过了能够承受的最大负载导致的。await:I/O 的平均响应时间,以毫秒为单位。这是应用需要承受的时间,它同时包含了I/O 队列时间和服务时间。超过预期的平均响应时间,可看作设备已饱和或者设备层面有问题的表征。aqu-szavgqu-sz:设备请求队列的平均长度。比1大的值有可能是发生饱和的表征(不过对有些设备,尤其是对基于多块磁盘的虚拟设备来说,通常以并行方式处理请求)。%util:设备使用率。这是设备繁忙程度的百分比,显示了每秒设备开展实际工作的时间占比。不过它展示的并不是容量规划意义下的使用率,因为设备可以并行处理请求。大于60%的值通常会导致性能变差(可以通过await(完成对一个请求的服务所需的平均时间(按毫秒计),该平均时间为请求在磁盘队列中等待的时间加上磁盘对其服务所需的时间) 字段确认),不过这也取决于具体设备。接近 100% 的值通常代表了设备达到饱和状态。iostat的扩展磁盘统计信息:
| 统计数据 | 说明 |
|---|---|
| rrqm/s | 在提交给磁盘前,被合并的读请求的数量 |
| wrqm/s | 在提交给磁盘前,被合并的写请求的数量 |
| r/s | 每秒提交给磁盘的读请求数量 |
| w/s | 每秒提交给磁盘的写请求数量 |
| rsec/s | 每秒读取的磁盘扇区数 |
| wsec/s | 每秒写入的磁盘扇区数 |
| rkB/s | 每秒从磁盘读取了多少KB的数据 |
| wkB/s | 每秒向磁盘写入了多少KB的数据 |
| avgrq-sz | 磁盘请求的平均大小(按扇区计) |
| avgqu-sz | 磁盘请求队列的平均大小。 |
| await | 完成对一个请求的服务所需的平均时间(按毫秒计),该平均时间为请求在磁盘队列中等待的时间加上磁盘对其服务所需的时间 |
| svctm | 提交到磁盘的请求的平均服务时间(按毫秒计)。该项表明磁盘完成一个请求所花费的平均时间。与await不同,该项不包含在队列中等待的时间 |
| %util | 利用率 |
当avgqu-sz的值特别大的时候,且请求等待时间await远远高于请求服务svctm所花费时间,且利用率%util为100%的时候,表明该磁盘处于饱和状态。
这有时会引起困惑,比如当
iostat(1)报告说某个设备已经达到100%的使用率后,还能够接受更高的负载。它只是报告某个设备在一段时间内100%繁忙,并没有说设备的使用率达到100%了:此时也许仍然可以接受更高的负载。在一个卷后面有多个磁盘设备支撑的情况下由于可以并行处理请求,iostat(1)中的%util这个指标就更加具有迷惑性。
┌──[root@vms100.liruilongs.github.io]-[~] └─$free -m totalusedfreesharedbuff/cache available Mem:15730756464405217257754 Swap:2067 02067
这个输出显示了用兆字节(MB)作为单位的可用内存。检查可用内存(available)是否接近0;这个值显示了在系统中还有多少实际剩余内存可用,包括缓冲区和页缓存区。将一些内存用于缓存可以提升文件系统的性能。可以根据不同的参数更换单位
┌──[root@vms100.liruilongs.github.io]-[~] └─$free -g totalusedfreesharedbuff/cache available Mem: 15 7 6 0 1 7 Swap: 2 0 2 ┌──[root@vms100.liruilongs.github.io]-[~] └─$
显示每个设备发送和接收的数据包数和字节数信息
┌──[root@vms100.liruilongs.github.io]-[~] └─$sar -n DEV 1 Linux 4.18.0-477.27.1.el8_8.x86_64 (vms100.liruilongs.github.io)2024年01月14日_x86_64_(4 CPU) 11时40分16秒 IFACE rxpck/s txpck/srxkB/stxkB/s rxcmp/s txcmp/srxmcst/s %ifutil 11时40分17秒lo 17.54 17.540.980.980.000.000.000.00 11时40分17秒ens160 50.88 58.773.794.070.000.000.880.00 11时40分17秒ens224224.560.00 18.850.000.000.001.750.00 11时40分17秒ens2560.000.000.000.000.000.000.000.00 11时40分17秒 ovs-system0.000.000.000.000.000.000.000.00 11时40分17秒br-tun0.000.000.000.000.000.000.000.00 11时40分17秒 tap9f7d35c5-150.000.000.000.000.000.000.000.00 11时40分17秒br-int0.000.000.000.000.000.000.000.00 11时40分17秒 br-ex0.000.000.000.000.000.000.000.00 ^C 平均时间: IFACE rxpck/s txpck/srxkB/stxkB/s rxcmp/s txcmp/srxmcst/s %ifutil 平均时间:lo 22.94 22.941.291.290.000.000.000.00 平均时间:ens160 50.22 51.083.704.320.000.000.870.00 平均时间:ens224224.240.00 18.700.000.000.001.300.00 平均时间:ens2560.000.000.000.000.000.000.000.00 平均时间: ovs-system0.000.000.000.000.000.000.000.00 平均时间:br-tun0.000.000.000.000.000.000.000.00 平均时间: tap9f7d35c5-150.000.000.000.000.000.000.000.00 平均时间:br-int0.000.000.000.000.000.000.000.00 平均时间: br-ex0.000.000.000.000.000.000.000.00 ┌──[root@vms100.liruilongs.github.io]-[~] └─$
| 列 | 说明 |
|---|---|
| rxpck/s | 数据包接收速率 |
| txpck/s | 数据包发送速率 |
| rxkB/s | kb接收速率 |
| txkB/s | kb发送速率 |
| rxcmp/s | 压缩包接收速率 |
| txcmp/s | 压缩包发送速率 |
| rxmcst/s | 多播包接收速率 |
显示每个设备的发送和接收错误信息
┌──[root@vms81.liruilongs.github.io]-[~/ansible] └─$sar -n EDEV 1 1 Linux 3.10.0-693.el7.x86_64 (vms81.liruilongs.github.io)2022年05月14日_x86_64_(2 CPU) 22时53分07秒 IFACE rxerr/s txerr/scoll/srxdrop/stxdrop/stxcarr/srxfram/srxfifo/stxfifo/s 22时53分08秒 ens320.000.000.000.000.000.000.000.000.00 22时53分08秒 cali86e7ca9e9c20.000.000.000.000.000.000.000.000.00 22时53分08秒 cali13a4549bf1e0.000.000.000.000.000.000.000.000.00 22时53分08秒 cali5a282a7bbb00.000.000.000.000.000.000.000.000.00 22时53分08秒 cali12cf25006b50.000.000.000.000.000.000.000.000.00 22时53分08秒 cali45e02b0b21e0.000.000.000.000.000.000.000.000.00 22时53分08秒lo0.000.000.000.000.000.000.000.000.00 22时53分08秒 calicb34164ec790.000.000.000.000.000.000.000.000.00 22时53分08秒 tunl00.000.000.000.000.000.000.000.000.00 22时53分08秒 docker00.000.000.000.000.000.000.000.000.00 平均时间: IFACE rxerr/s txerr/scoll/srxdrop/stxdrop/stxcarr/srxfram/srxfifo/stxfifo/s 平均时间: ens320.000.000.000.000.000.000.000.000.00 平均时间: cali86e7ca9e9c20.000.000.000.000.000.000.000.000.00 平均时间: cali13a4549bf1e0.000.000.000.000.000.000.000.000.00 平均时间: cali5a282a7bbb00.000.000.000.000.000.000.000.000.00 平均时间: cali12cf25006b50.000.000.000.000.000.000.000.000.00 平均时间: cali45e02b0b21e0.000.000.000.000.000.000.000.000.00 平均时间:lo0.000.000.000.000.000.000.000.000.00 平均时间: calicb34164ec790.000.000.000.000.000.000.000.000.00 平均时间: tunl00.000.000.000.000.000.000.000.000.00 平均时间: docker00.000.000.000.000.000.000.000.000.00 ┌──[root@vms81.liruilongs.github.io]-[~/ansible] └─$
| 列 | 说明 |
|---|---|
| rxerr/s | 接收错误率 |
| txerr/s | 发送错误率 |
| co11/s | 发送时的以太网冲突率 |
| rxdrop/s | 由于Linux内核缓冲区不足而导致的接收帧丢弃率 |
| txdrop/s | 由于Linux内核缓冲区不足而导致的发送帧丢弃率 |
| txcarr/s | 由于载波错误而导致的发送帧丢弃率 |
| rxfram/s | 由于帧对齐错误而导致的接收帧丢弃率 |
| rxfifo/s | 由于FIFO错误而导致的接收帧丢弃率 |
| txfifo/s | 由于FIFO错误而导致的发送帧丢弃率 |
显示使用套接字(TCP、UDP和RAW)的总数信息
┌──[root@vms81.liruilongs.github.io]-[~/ansible] └─$sar -n SOCK 1 3 Linux 3.10.0-693.el7.x86_64 (vms81.liruilongs.github.io)2022年05月14日_x86_64_(2 CPU) 22时56分23秒totscktcpsckudpsckrawsck ip-fragtcp-tw 22时56分24秒3487 245 9 0 0 163 22时56分25秒3487 245 9 0 0 165 22时56分26秒3487 245 9 0 0 167 平均时间:3487 245 9 0 0 165 ┌──[root@vms81.liruilongs.github.io]-[~/ansible] └─$
| 列 | 说明 |
|---|---|
| totsck | 当前正在被使用的套接字总数 |
| tcpsck | 当前正在被使用的TCP套接字总数 |
| udpsck | 当前正在被使用的UDP套接字总数 |
| rawsck | 当前正在被使用的RAW套接字总数 |
| ip-frag | IP分片的总数 |
┌──[root@vms100.liruilongs.github.io]-[~] └─$sar -n TCP,ETCP 1 Linux 4.18.0-477.27.1.el8_8.x86_64 (vms100.liruilongs.github.io)2024年01月14日_x86_64_(4 CPU) 11时39分24秒active/s passive/siseg/soseg/s 11时39分25秒0.000.00 16.50 16.50 11时39分24秒atmptf/sestres/s retrans/s isegerr/s orsts/s 11时39分25秒0.000.000.000.00 15.53 11时39分25秒active/s passive/siseg/soseg/s 11时39分26秒0.000.005.005.00 11时39分25秒atmptf/sestres/s retrans/s isegerr/s orsts/s 11时39分26秒0.000.000.000.004.00 ................................. ^C 平均时间:active/s passive/siseg/soseg/s 平均时间:0.000.00 17.82 17.82 平均时间:atmptf/sestres/s retrans/s isegerr/s orsts/s 平均时间:0.000.000.000.00 16.83 ┌──[root@vms100.liruilongs.github.io]-[~] └─$
使用sar(1)工具来查看TCP 指标和TCP 错误信息。相关的字段包括如下几个。
active/s:每秒本地发起的 TCP连接的数量(通过调用connect0)创建)。passive/s:每秒远端发起的 TCP连接的数量(通过调用accept0创建)。retrans/s:每秒TCP 重传的数量。orsts/s:每秒的连接重置数。表示每秒钟发生的连接重置次数。atmptf/s:每秒的连接尝试次数。表示每秒钟有多少个连接尝试被发起。estres/s:每秒建立的连接数。表示每秒钟成功建立的连接数。主动和被动连接计数对于业务负载画像很有用。重传则是网络或者远端主机有问题的征兆。
┌──[root@vms100.liruilongs.github.io]-[~] └─$top top - 11:46:44 up 8 min,1 user,load average: 6.52, 17.45, 10.38 Tasks: 449 total, 1 running, 448 sleeping, 0 stopped, 0 zombie %Cpu(s):0.9 us,1.1 sy,0.0 ni, 96.8 id,0.0 wa,0.6 hi,0.5 si,0.0 st MiB Mem :15730.5 total, 7503.6 free, 7147.4 used, 1079.5 buff/cache MiB Swap: 2068.0 total, 2068.0 free,0.0 used. 8177.7 avail Mem PID USERPRNIVIRTRESSHR S%CPU%MEM TIME+ COMMAND 1947 42418 20 0555196 13297220272 S 1.3 0.8 0:12.86 heat-engine 10320 42436 20 0540276 12220017492 S 1.3 0.8 0:08.95 nova-scheduler 949 root20 06940723164016876 S 1.0 0.2 0:16.58 tuned 1945 42415 20 0749212 14256434988 S 1.0 0.9 0:12.38 glance-api 1965 42436 20 0540120 12184817324 S 1.0 0.8 0:12.16 nova-conductor 15567 root20 0269540 5228 4160 R 1.0 0.0 0:00.05 top ..........................................
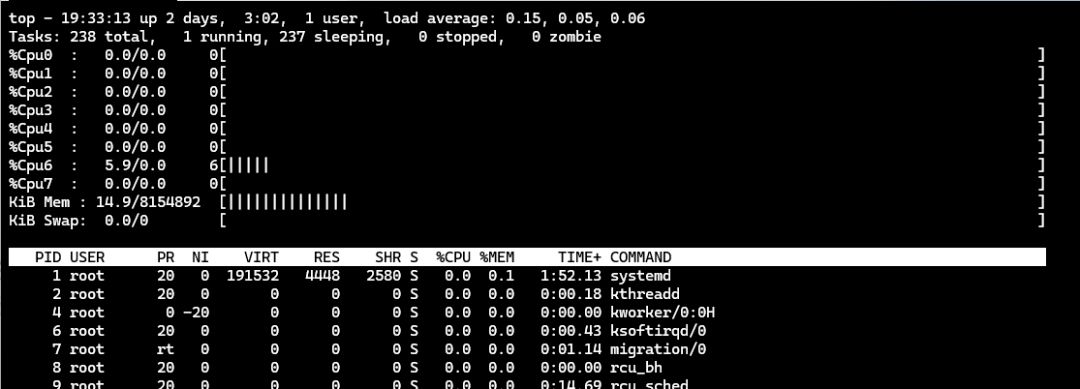
以top命令作为结束,对相关结果进行二次确认,并能够浏览系统和进程的摘要信息运气好的话,这个60 秒分析过程会帮助你找到一些性能问题的线索。
可以通过 t 键和 m 对数据进行可视化展示
top - 19:32:22 up 2 days,3:01,1 user,load average: 0.00, 0.02, 0.05 Tasks: 237 total, 2 running, 235 sleeping, 0 stopped, 0 zombie %Cpu0: 0.0/0.0 0[ ] %Cpu1: 0.0/0.0 0[ ] %Cpu2: 0.0/0.3 0[ ] %Cpu3: 0.0/0.0 0[ ] %Cpu4: 0.0/0.0 0[ ] %Cpu5: 0.0/0.0 0[ ] %Cpu6: 0.0/0.0 0[ ] %Cpu7: 0.0/0.0 0[ ] KiB Mem : 14.9/8154892[|||||||||||||| ] KiB Swap:0.0/0[ ]
The above is the detailed content of Linux 60 Seconds Quick Performance Analysis Operation Manual. For more information, please follow other related articles on the PHP Chinese website!


![[Web front-end] Node.js quick start](https://img.php.cn/upload/course/000/000/067/662b5d34ba7c0227.png)


